


- Gold analysis: Metals within $5 shy of $2300 in another record hitting session
- ISM PMI misses, but ADP beats
- Gold analysis: Metal looking technically overbought
Gold analysis video and insights on Silver, WTI and FX majors
Gold hit yet another record all-time high today as the strong momentum continued after the release of weaker-than-expected US ISM PMI, which fuelled a sell-off in the dollar across the board – not that gold has been paying much attention to the US dollar in this run up. Nevertheless, the renewed dollar weakness propelled the metal to a new high of just $5 shy of $2300. Gold is now looking extremely overbought again, and I am expecting to see a pullback soon as traders take profit. However, a small correction, if seen, is not going to mean the end of the bullish trend.
Gold analysis: Why have precious metals been rallying?
The surge in precious metals can be attributed to several factors. Firstly, persistent inflation over the years has gradually eroded the value of fiat currencies, prompting investors to seek refuge in assets like gold and Bitcoin, both of which have been hitting record levels. Anticipation of interest rate cuts by the Federal Reserve, potentially in June and possibly multiple times thereafter, as well as similar moves expected from major central banks like the ECB and BoE, has further fuelled this trend. Futures market indicate a probability of a quarter-point rate reduction by June, with recent comments from Fed Chairman Jerome Powell supporting this outlook. Additionally, core PCE inflation data, released last week, aligned with market expectations, strengthening the case for a rate cut.
Furthermore, optimism surrounds the potential recovery of Chinese demand, as indicated by improving data from the world's second-largest economy, particularly highlighted in the latest PMI figures over the weekend. A stronger Chinese economy typically correlates with increased demand for precious metals, amplifying their prices. For the same reason, we have seen copper and silver, with the latter also seen as an industrial metal, break out.
Another contributing factor to the rally in gold is momentum, with traders inclined to speculate in assets that exhibit strong bullish momentum.
In summary, the rally in precious metals stems from a combination of factors including inflationary pressures, expectations of interest rate cuts, optimism regarding Chinese demand, and momentum-driven trading behaviour.
ISM PMI misses, but ADP beats
Today’s key data releases from the US revealed a mixed picture. While the ADP employment reported revealed private jobs increased by 184K in March, which was more than 148K expected, the employment component of the ISM PMI came in weaker at 48.5 vs. 49.0 expected, although it did rise from 48.0 in the previous month (still in contraction, mind you). But it was the ISM’s price paid index which caused the dollar to drop – it fell sharply to 53.4 from 58.6. This was the lowest reading in the sub index since March 2020, when it had registered 50.4 percent. “However, respondents indicated that even with some prices stabilizing, inflation is still a concern." The headline ISM Services PMI printed 51.4 vs. 52.8 expected and 52.6 last.
Gold analysis: Metal looking technically overbought
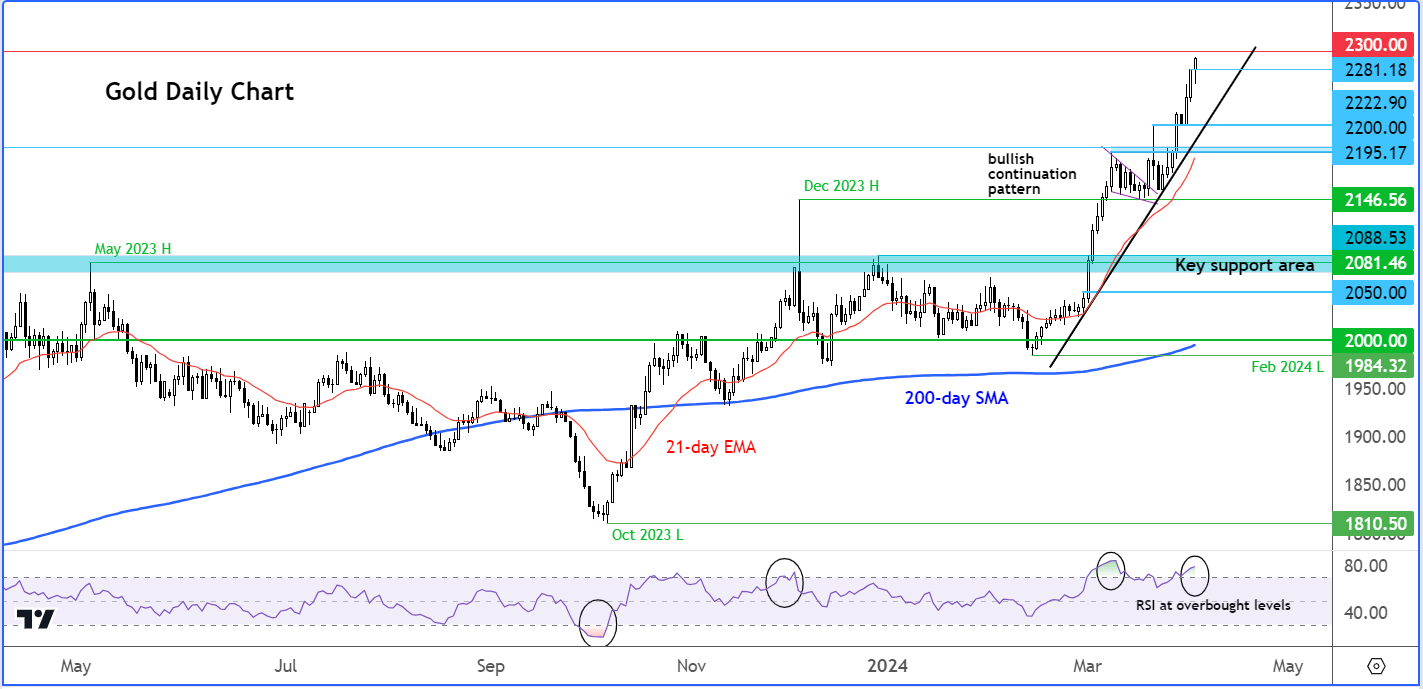
Source: TradingView.com
The markets can remain overbought/oversold longer than… you know the rest. But the gold chart does need to work off its overbought conditions, to encourage fresh buying. It can do so through time – simply by consolidating, momentum indicators like the RSI will start to fall back. There are now several support areas to watch for a bounce on any short-term weakness. Among these levels, $2222 is key, followed by the area around $2200 in as far as short-term levels are concerned. Long-term support levels include the base of the major breakout around the $2080 area. On the upside, as the metal is trading at record levels, there are no prior reference points to target specifically. Thus, which round psychologically important levels where profit-taking might occur. These levels include $2300 which could be the next target for the bulls, followed by $2400 etc.
-- Written by Fawad Razaqzada, Market Analyst
Follow Fawad on Twitter @Trader_F_R
How to trade with City Index
You can trade with City Index by following these four easy steps:
-
Open an account, or log in if you’re already a customer
• Open an account in the UK
• Open an account in Australia
• Open an account in Singapore
- Search for the company you want to trade in our award-winning platform
- Choose your position and size, and your stop and limit levels
- Place the trade
Latest market news
Yesterday 01:32 PM
Yesterday 09:35 AM
Yesterday 07:23 AM
Yesterday 04:48 AM
Yesterday 12:17 AM
July 25, 2024 10:39 PM
Latest Gold articles

July 22, 2024 02:47 AM

July 15, 2024 01:00 AM

July 9, 2024 02:32 AM

July 4, 2024 02:30 PM