


- Gold analysis: Technical levels and factors to watch
- Gold hits yet another record high, but watch out for possible correction
- Gold's resistance against rising yields may be short-lived
Welcome to another edition of Technical Tuesday, a weekly report where we highlight some of the most interesting markets that will hopefully appease technical analysts and traders alike. In this edition, we will get technical on gold and highlight the increased risks of a pullback, in what has been one of the strongest rallied for the precious metal in recent years.
Gold analysis video and insights on WTI, S&P, USD/JPY and EUR/USD
Gold hits yet another record high, but watch out for possible correction
Gold is now flashing “overbought” conditions on multiple long-term charts, pointing to a possible correction. This comes as the likelihood of a June Fed rate cut has diminished, and yields have been increasing. Also, don’t forget about the supply side of the question. Commercial hedging etc., from gold producers could limit the upside potential.
So, despite my long-term bullish outlook on gold, given the current conditions, I anticipate a bearish reversal, perhaps even a minor one, which could nonetheless offer opportunities for bearish traders for a while. I'll be closely monitoring whether this reversal materialises around these levels and within this week, with CPI having the potential to cause a bit of fireworks on Wednesday. But until we see a concrete reversal signal, bearish traders should not pre-empt it by going against this strong trend blindly. Bullish traders may wish to proceed with extra care at these levels.
Gold’s latest rally to a new high today was not supported by any fresh news. It was driven in part because of technical momentum, thanks to the strong gains lately. But following a big rally, the metal is now finding itself at extremely overbought levels. A correction should not come as a major surprise.
Gold's resistance against rising yields may be short-lived
Despite the rise in US bond yields and positive economic data, gold investors seem unfazed, as evidenced by the metal reaching a new record despite Friday's robust US jobs report, which boasted a headline figure of over 300K. However, the increasing yields on government debt raise the opportunity cost of holding gold, considering its lack of interest-bearing characteristics. Consequently, the likelihood of a correction is growing. At some point, investors may prioritise allocating their capital towards fixed guaranteed returns rather than relying on the potential for further appreciation in gold. The metal has already risen nearly 20% since its February low. So, it is looking a bit expensive at current levels, even if the long-term outlook remains positive.
Gold analysis: Technical levels and factors to watch
Gold’s long-term chart show that price is currently at the 161.8% Fibonacci extension of the 2020-2022 downswing around $2360, signalling caution for a potential reversal. What’s more, the Relative Strength Index (RSI), which is an indicator of momentum is at extreme overbought levels on multiple time frames. The overbought conditions can be worked off through time, if gold consolidates around current levels for a few days, without giving back too much ground, say past the $2222 level. This would be the optimal scenario for gold investors, considering the metal's rapid ascent in recent days.
On the daily time frame, we can identify our short-term levels to watch.
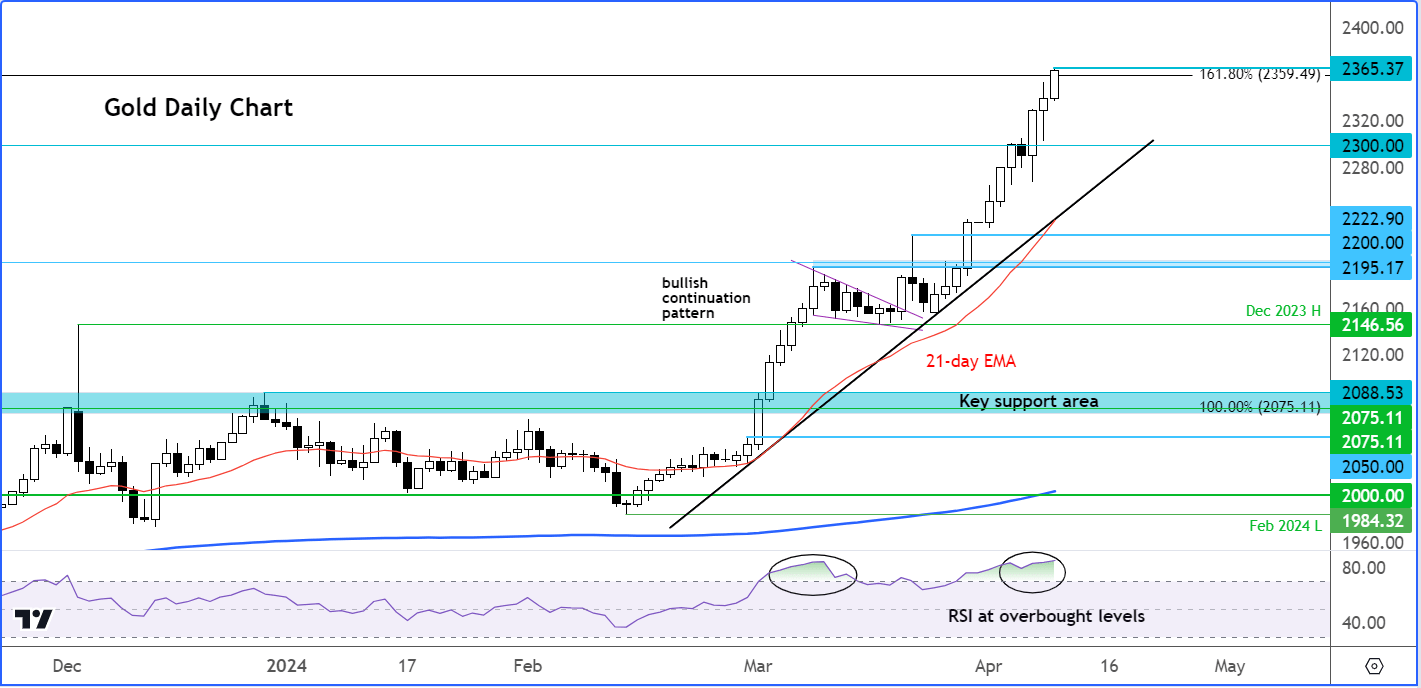
Short-term support rests at around $2300, with a more significant area of support around $2222, followed by the range between $2195 and $2200. Notably, the $2222 level aligns with both the 21-day exponential moving average and the bullish trend line. Could we witness a decline to this level in the forthcoming days?
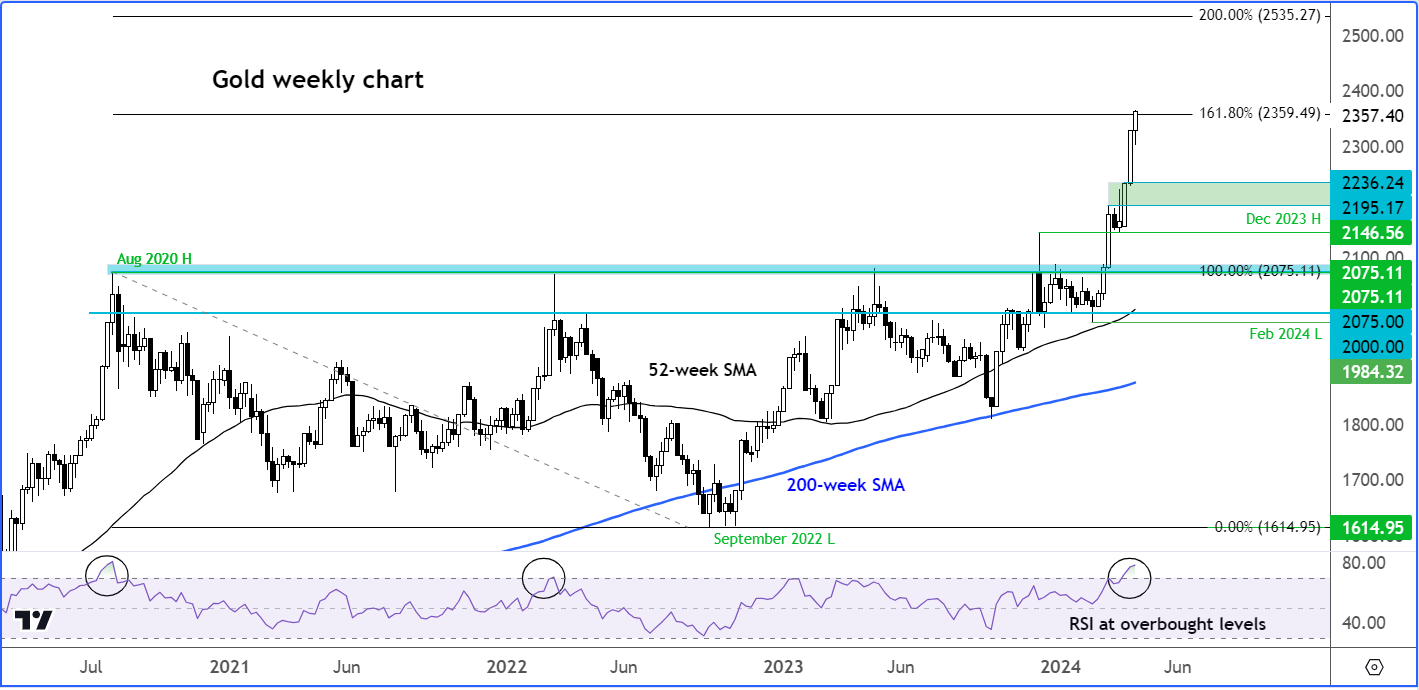
The weekly gold chart shows the area between $2195 to $2236 as the first area of important support, followed by the December high at $2146 and finally that long-term pivotal zone of $2075-$2081.
The monthly chart of gold shows a similar picture,, but on this time frame it that long-term pivotal zone of $2075-$2081 that stands out as major support.
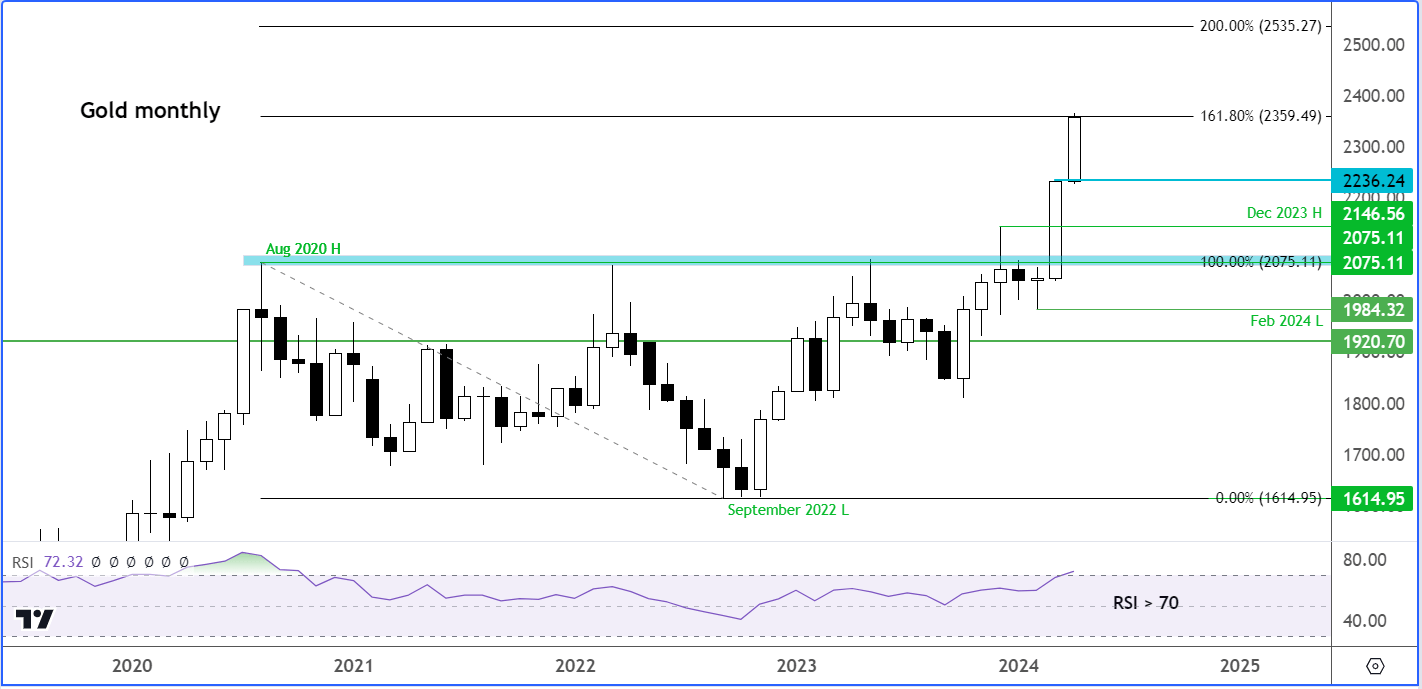
On all the above charts, one thing that is in common is the RSI indicator being in overbought territories. The daily RSI is at 85.0, while both weekly (80) and monthly (>70) RSI indicators are at extreme levels.
Gold is therefore looking rather overbought, judging by the RSI indicator – in fact by almost any metric you employ.
In previous occasions that gold had moved above the overbought threshold, especially on the long-term charts, it was preceded by a sell off. While past price action is not necessarily an indicator of future performance, you can’t ignore the risk of gold heading at least a little lower from current levels and in light of a sharp two-week rally.
In addition to the RSI being in overbought territory, the metal has now reached the 161.8% Fibonacci extension level of the downswing from August 2020 to September 2022, at around $2360. This makes it an ideal are for bullish traders to ease off the gas, you would imagine.
Should a slight retracement occur, it may not mark the conclusion of the upward trend. In fact, traders and investors who missed the chance to purchase gold at lower prices will likely seize any downturns to acquire it.
Source for all charts used in this article: TradingView.com

-- Written by Fawad Razaqzada, Market Analyst
Follow Fawad on Twitter @Trader_F_R
How to trade with City Index
You can trade with City Index by following these four easy steps:
-
Open an account, or log in if you’re already a customer
• Open an account in the UK
• Open an account in Australia
• Open an account in Singapore
- Search for the company you want to trade in our award-winning platform
- Choose your position and size, and your stop and limit levels
- Place the trade
Latest market news
Yesterday 01:32 PM
Yesterday 09:35 AM
Yesterday 07:23 AM
Yesterday 04:48 AM
Yesterday 12:17 AM
July 25, 2024 10:39 PM
Latest Gold articles

July 22, 2024 02:47 AM

July 15, 2024 01:00 AM

July 9, 2024 02:32 AM

July 4, 2024 02:30 PM