


- Gold analysis: Has gold selling already or nearly done?
- Gold remains fundamentally supported in the long term
- Gold technical analysis shows prices no longer as overbought
Gold analysis video and insights on silver
Gold prices fell a further 1.5% by mid-morning European trade after Monday’s sharp 2.7% drop to just below the key $2300 level. The metal is now no longer as technically overbought and with much of the long-term fundamental drivers still intact, could we see gold start a new bullish trend from here?
Gold analysis: Has gold selling already or nearly done?
In the last couple of weeks, I have been calling for a bit of a pullback in gold prices, which finally took place at the start of this week. This was thanks in part to diminished risk of an outright war between Israel and Iran, which therefore reduced the haven appeal of gold somewhat. However, a reduction in geopolitical risks was not the base case for my call. It was mainly the fact that prices had become extremely overbought from a technical point of view, which needed to be worked off. To a much lesser degree, I was also concerned about the continued sell off in the bond markets, pushing up their yields and thus increasing the opportunity cost of holding non-interest-bearing assets. While the latter case remains valid, gold prices are no longer as overbought as they were a couple of weeks ago. With gold now back to my first downside target of around $2300, I am now no longer too confident we will see an even deeper correction. But what I am confident about is that my longer-term bullish view on gold remains intact. I therefore expect to see fresh record highs in the not-too-distant future. But, for now, the key question is what happens next: has gold formed a near-term top or was that just a small dip before we see new records broken?
Gold remains fundamentally supported in the long term
While the potential for a larger correction is certainly there, there are many investors who have missed out on the big rally in gold and will be looking to pick up dips like these. Gold bears would argue that yields are still elevated, and the probability of a rate cut in June by the Fed has been slashed, which should keep the dollar supported and buck-denominated precious metals under pressure. The bulls on the other hand would point to the fact that gold has previously ignored all the strength we saw in the US dollar and yields. Who is to say, the bulls would argue, that this trend cannot resume now that prices are no longer technically overbought? For indeed, gold’s fundamental drivers remain largely in place. Namely, these are continued central bank purchases and hedging against inflation. After years of above-forecast, and in some countries double-digit, inflation, fiat currencies have lost significant chunk of their values. Some investors view gold as the ultimate hedge against inflation, which is partly why it has performed so well.

Gold technical analysis
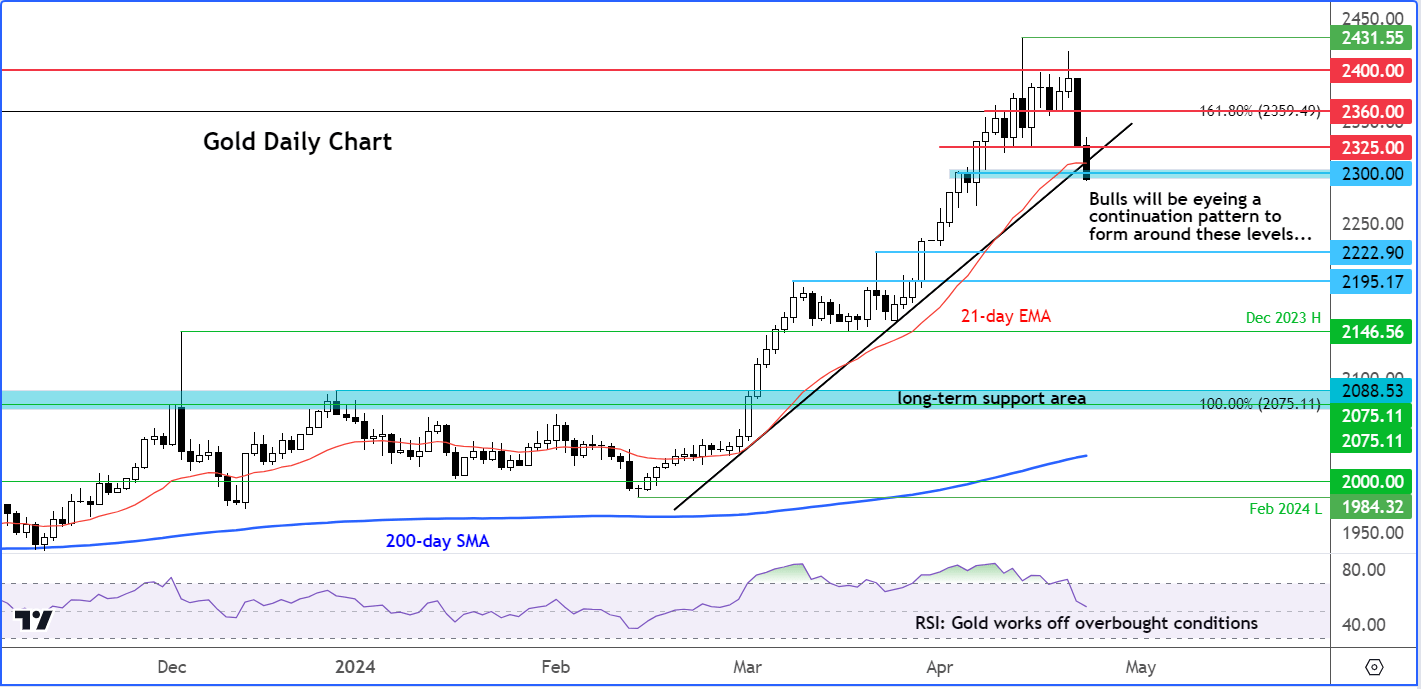
Source: TradingView.com
While the bullish and bearish arguments continue, as traders we seek to profit from changes in prices regardless of the direction on the gold chart. It is always beneficial to trade in the direction of the longer-term trend, which has clearly been bullish on gold. With that in minds, I would now be eying for a bullish signal to emerge around current levels to suggest that a low is in place. A bullish continuation pattern such as a bull flag or triangle around these levels would be ideal, as gold trades around the 21-day exponential moving averages, which tends to be a decent moving support in strongly-trending markets. What’s more, gold is now testing the short-term bullish trend line and the first major short-term support around $2300.
However, if gold does not show any bullish price action around $2300 (give or take $10 or so), then we could see a deeper pullback towards the next key level of support around the $2222 area.
-- Written by Fawad Razaqzada, Market Analyst
Follow Fawad on Twitter @Trader_F_R
How to trade with City Index
You can trade with City Index by following these four easy steps:
-
Open an account, or log in if you’re already a customer
• Open an account in the UK
• Open an account in Australia
• Open an account in Singapore
- Search for the company you want to trade in our award-winning platform
- Choose your position and size, and your stop and limit levels
- Place the trade
Latest market news
Yesterday 01:32 PM
Yesterday 09:35 AM
Yesterday 07:23 AM
Yesterday 04:48 AM
Yesterday 12:17 AM
July 25, 2024 10:39 PM
Latest Gold articles

July 22, 2024 02:47 AM

July 15, 2024 01:00 AM

July 9, 2024 02:32 AM

July 4, 2024 02:30 PM