


- Gold analysis: Geopolitical risks could keep gold supported on dips
- Rising yields increase opportunity cost of holding gold
- Gold technical analysis point to overbought conditions
This morning saw gold manage to rebound after Friday's bearish close, although the positive performance of European stock markets and the adverse reaction of oil to the weekend events suggest there may be diminished appetite for safe-haven assets – at least for now. The just-released strong US retail sales data has further reduced the odds of a June Federal Reserve rate cut, which bodes ill for gold. Consequently, there is a risk that gold could trend lower and extend its sell-off that initiated on Friday, when its recent surge to a new all-time high encountered substantial selling pressure in the latter part of the day, resulting in a bearish price candle on its daily chart. Let’s see if we gold bears will now re-emerge after having a torrid time in the last couple of months or so. They will certainly need to see some downside follow-through in the next couple of days to be encouraged to stand in the way of what has been a strong near 20% rally in the last few weeks.
Gold analysis: Geopolitical risks could keep gold supported on dips
On Friday, gold surpassed the $2400 threshold to reach a new peak of $2431 per ounce, as traders sought refuge amid reports of Iran's intentions to attack Israel over the weekend, stimulating demand for safe-haven assets. However, it retraced by the session's close as technical indicators had pointed to an overheated rally. Nevertheless, renewed concerns over geopolitical tensions in the Middle East could reignite safe-haven demand if and when we see a decent pullback, with apprehensions about potential Israeli retaliation likely to dampen bearish sentiment towards gold.
So, any potential downward correction should be interpreted as merely corrective, potentially attracting side-lined buyers at lower price levels. This scenario holds unless there is an abrupt de-escalation of geopolitical tensions, which does not seem imminent in the near term.
Gold analysis: Rising yields increase opportunity cost of holding gold
Still, following Friday's bearish price action, it's plausible that today's modest recovery could trigger further profit-taking as the session progresses, especially now that we have had further strength in US data. At some point, even the most bullish gold investors will have to consider rising yields will ultimately make bonds more attractive for yield seekers in favour of zero or low-yielding assets. After all, with the Japanese yen slumping to fresh multi-decade lows against the US dollar (Japanese bonds still pay a low yield), you would think gold would follow suit. The USD/JPY was now just 60 pips away from key 155.00 level.
Gold technical analysis point to overbought conditions
After Friday's price action, which appeared to indicate a reversal as the metal sharply declined after reaching a new record high, traders may be contemplating the possibility of further short-term losses this week before witnessing renewed interest from buyers looking to capitalise on lower prices.
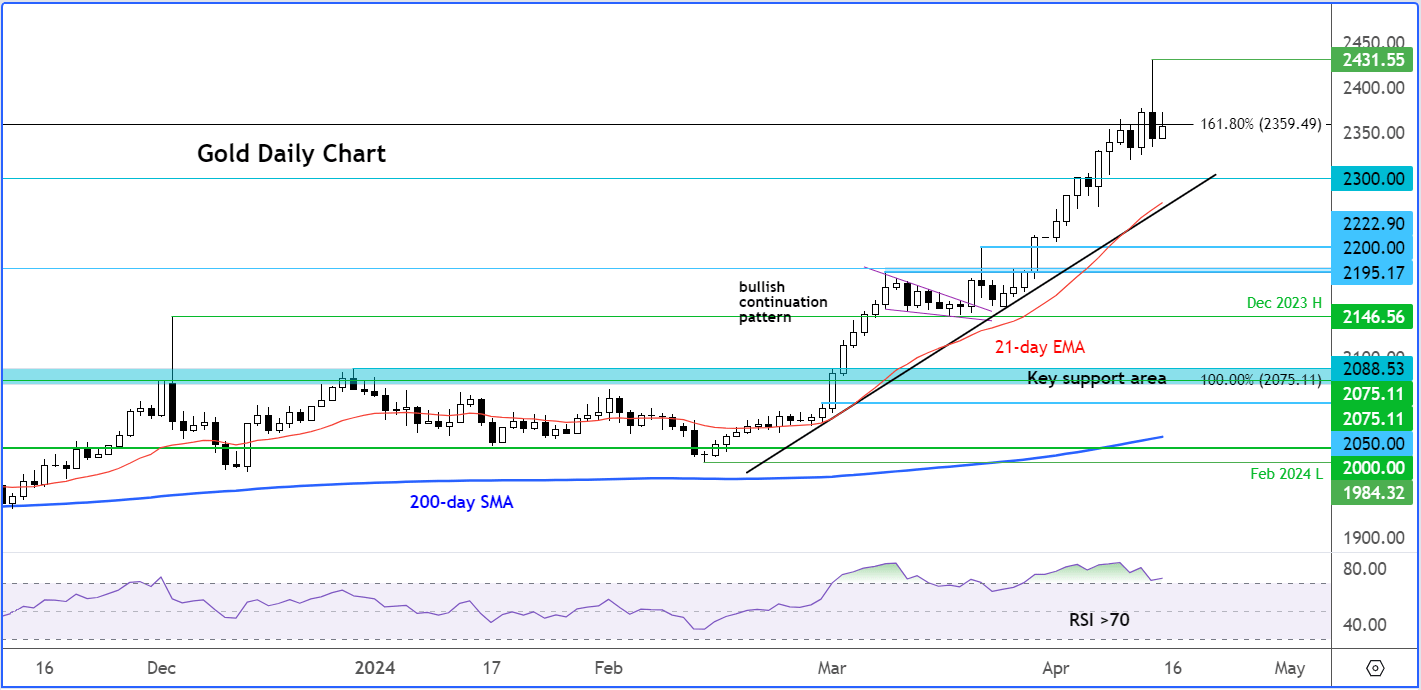
As of the time of writing, at just after mid-day in London, there hadn't been any immediate downward movement. However, it's important to monitor the $2333 level, which was Friday's low, especially if we approach it later on in the day. A breach below this level, if sustained, could initiate additional technical selling, potentially resulting in a decline towards support at $2300 initially, followed by the $2270-80 range. This range corresponds to the convergence of the short-term bullish trend line and the 21-day exponential moving average.
Gold's long-term charts display a bullish outlook, yet there's undeniable evidence of overbought conditions across various time frames. Therefore, it wouldn't be surprising to witness some short-term weakness.
Last week, gold surpassed the 161.8% Fibonacci extension of the 2020-2022 downswing, reaching a new record of $2431 by Friday. However, Friday's bearish close warrants caution, which potentially signals a reversal. Additionally, the Relative Strength Index (RSI), a momentum indicator, indicates extremely high levels across different time frames, suggesting overbought conditions. These conditions can normalise over time, if gold hangs around the current levels or retraces modestly for a few weeks. This would be an ideal bullish scenario for gold investors amidst the recent rapid price surge. Alternatively, the RSI's overbought conditions could alleviate through a sharp pullback, which would appease the bears.
In terms of short-term support, the $2222 level stands out, located within the $2195 to $2236 range, where the most recent phase of the rally commenced a couple of weeks ago as can be seen on the weekly chart. Subsequently, the December high at $2146 presents another support level, followed by the crucial long-term zone of $2075-$2081, which now holds paramount importance in gold's technical landscape.
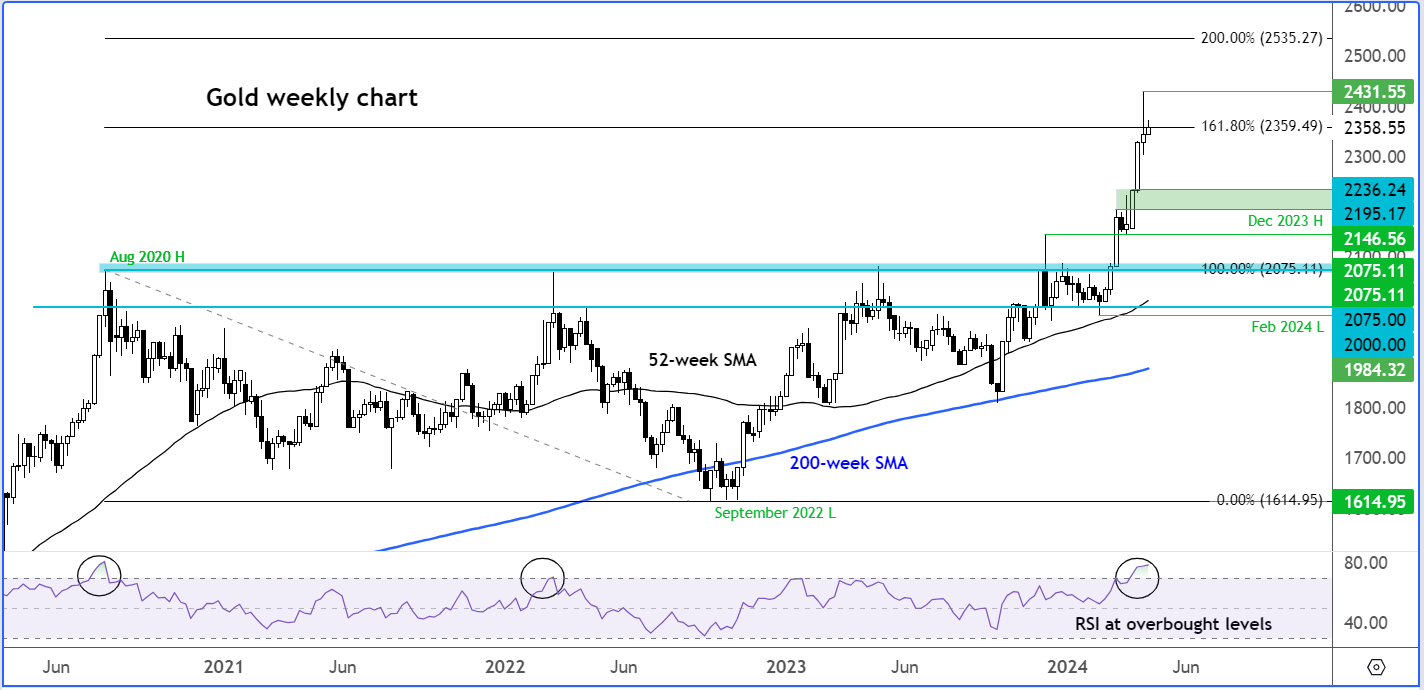
Across all charts, a consistent observation is the RSI indicator residing in overbought territories. The daily RSI, weekly and monthly RSI indicators are all above 70.0, with some signalling extreme levels.
Consequently, the gold chart appears markedly overbought, evident from the RSI indicator and virtually any other metric you consider. Following Friday's bearish-looking price candle, my inclination leans towards seeking bearish trades concerning the short term, despite my bullish long-term outlook.
Historically, when gold has breached overbought levels, especially on long-term charts, it has typically preceded a sell-off. While past patterns don't guarantee future outcomes, the prospect of gold retracing somewhat from its current levels merits attention.
Nonetheless, any potential near-term downturn may not signify the termination of the broader upward trend. Rather, traders and investors who missed out on purchasing gold at lower prices are likely to view any dips as an opportunity to enter the market once gold is no longer technically overbought.

Source for all charts used in this article: TradingView.com
-- Written by Fawad Razaqzada, Market Analyst
Follow Fawad on Twitter @Trader_F_R
How to trade with City Index
You can trade with City Index by following these four easy steps:
-
Open an account, or log in if you’re already a customer
• Open an account in the UK
• Open an account in Australia
• Open an account in Singapore
- Search for the company you want to trade in our award-winning platform
- Choose your position and size, and your stop and limit levels
- Place the trade
Latest market news
Yesterday 01:32 PM
Yesterday 09:35 AM
Yesterday 07:23 AM
Yesterday 04:48 AM
Yesterday 12:17 AM
July 25, 2024 10:39 PM
Latest Gold articles

July 22, 2024 02:47 AM

July 15, 2024 01:00 AM

July 9, 2024 02:32 AM

July 4, 2024 02:30 PM