


Asian Indices:
- Australia's ASX 200 index rose by 26.8 points (0.38%) and currently trades at 7,165.70
- Japan's Nikkei 225 index has risen by 539.26 points (1.63%) and currently trades at 33,557.91
- Hong Kong's Hang Seng index has fallen by -26.11 points (-0.13%) and currently trades at 19,495.31
- China's A50 Index has risen by 99.52 points (0.78%) and currently trades at 12,803.89
UK and Europe:
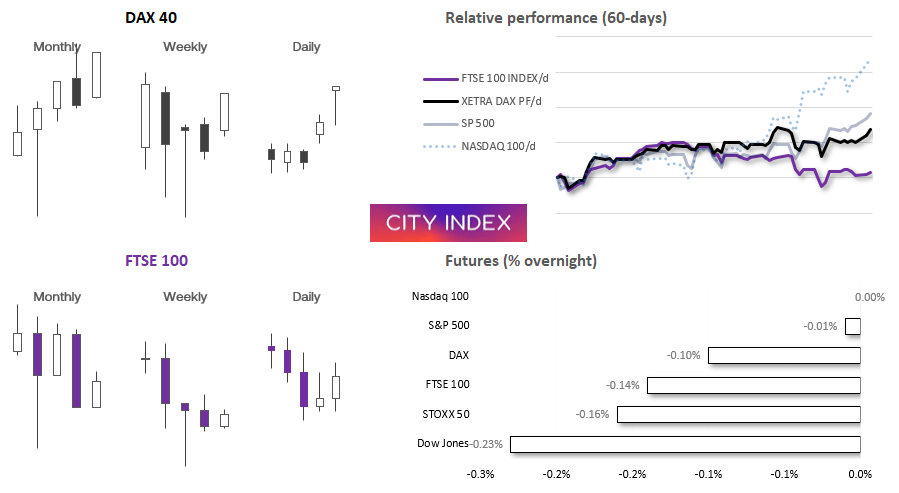
- UK's FTSE 100 futures are currently down -11 points (-0.14%), the cash market is currently estimated to open at 7,583.78
- Euro STOXX 50 futures are currently down -7 points (-0.16%), the cash market is currently estimated to open at 4,340.55
- Germany's DAX futures are currently down -18 points (-0.11%), the cash market is currently estimated to open at 16,212.68
US Futures:
- DJI futures are currently down -71 points (-0.21%)
- S&P 500 futures are currently up 0.5 points (0.01%)
- Nasdaq 100 futures are currently up 1.75 points (0.01%)
FOMC day has finally rolled around, although yesterday’s soft inflation report has but confirmed the consensus view that the Fed will pause. Therefore, it is more about the perception of futures decisions (if any) and how long rates are deemed to remain high. As is the case at the end of each quarter, the decision is delivered in two halves; the usual interest rate decision and statement is also released alongside updated staff forecasts and the famous dot plot the, thirty minutes later, Jerome Powell hits the microphone to deliver a speech and field questions. Don’t too surprised some confusion-based volatile arrives as Powell’s speech aims to reverse the earlier market reaction.
It is worth keeping in mind that the US dollar has been falling for the past two weeks in anticipation of a pause, with cooler inflation consumer inflation expectations and soft CPI keeping the USD on the ropes this week. But it has now pulled back to the point I am left wondering whether there are pent up hopes for some sort of dovish undertone. And that leaves room for USD strength should they deliver a hawkish pause (which seems more likely, given relatively high levels of inflation).
To justify the dollar’s pullback and likely weigh upon it further, we may see a bearish USD reaction if inflation forecasts or parts of the dot plot are lowered (to signal lower interest rate expectations). Traders will also scrutinise the statement, but I generally find that people will find that they want to see in that famous document, which leaves Jerome Powell the opportunity to the ‘correct’ the market reaction and reinforce the Fed’s actual view.
EUR/USD 4-hour chart:
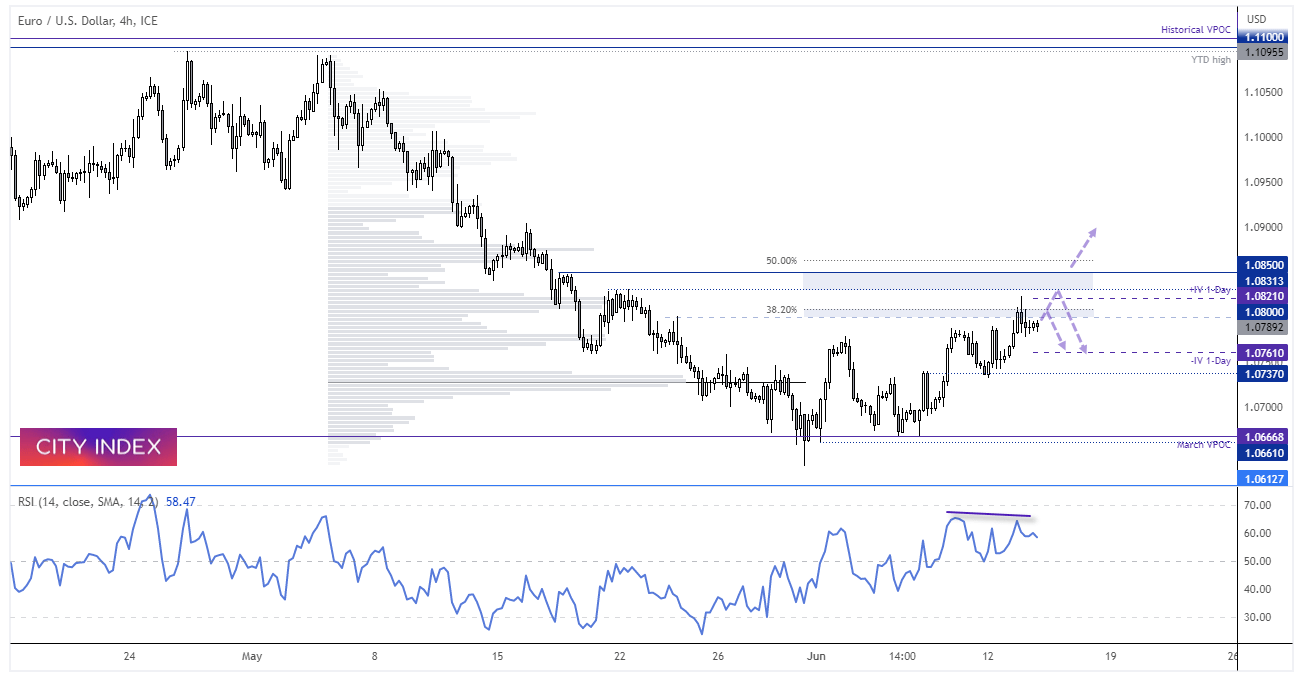
EUR/USD is trending higher on 4-hour chart, although it remains too seen to say whether this is part of a retracement before losses resume, or a cycle low has been seen at the end of May. Given the Fed are at or very near their terminal rate and the ECB are likely to hike at least another 50bp. It could be the former. But from a technical standpoint, EUR/USD is headed for several levels of resistance which could see it head back towards 1.0700 initially before its next leg higher.
The overnight implied volatility zone (purple +IV and -IV bands) are not particularly wide given we have an FOMC and ECB meeting on the horizon, which suggests expectations are largely priced in. And whilst EUR/USD has flirted with a break above 1.0800, I think it will struggle to hold above 1.0850 unless a surprise dovish pause is coupled with a hawkish ECB hike. We may we price climb into the meeting in anticipation, but unless the Fed surprise with a dovish pause, lower inflation forecasts and dot plot, I suspect we may see a swing high form around the 1.0800 – 1.0850 region.
USD/JPY 4-hour chart:
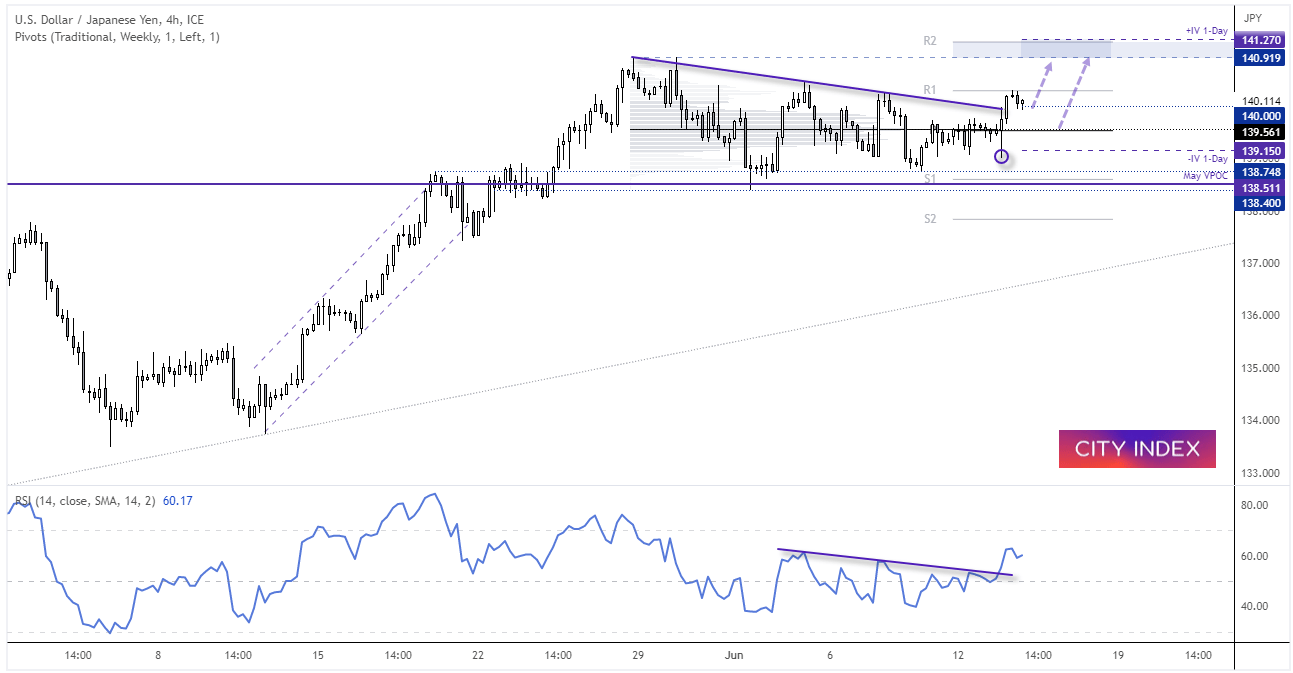
USD/JPY has been within a sideways consolidation since the end of May, although momentum is trying to revert higher in line with the bullish daily trend. A wide-legged candle reaffirmed support around 139 before prices broke above a retracement line along with its RSI. The most traded price within the consolidation was around 139.56, which may provide support if prices pull back before the anticipated move higher towards 141 and potentially beyond. Take note that the upper overnight implied volatility level sits around the weekly R2 pivot at 142.27. A break below 138.40 assumes a dovish Fed pause has been delivered and invalidates the bullish bias.
Economic events up next (Times in GMT+1)
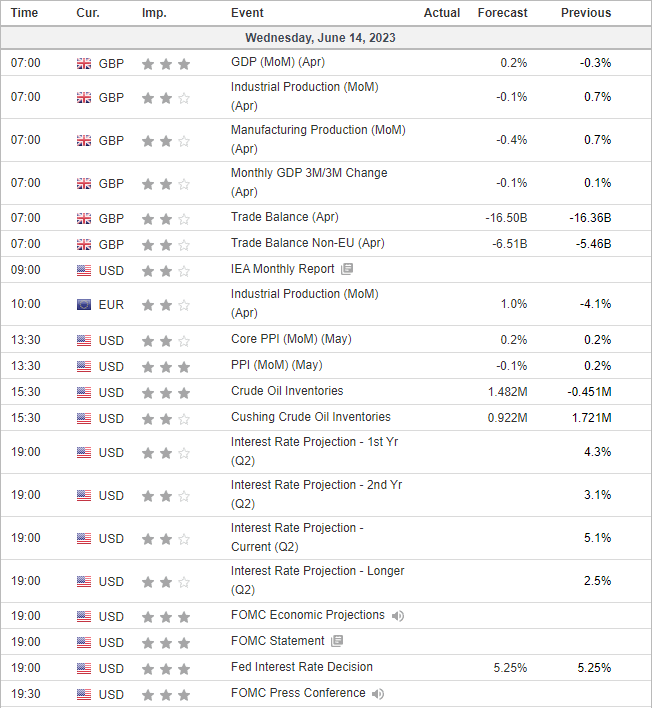
View the full economic calendar
-- Written by Matt Simpson
Follow Matt on Twitter @cLeverEdge
How to trade with City Index
You can trade with City Index by following these four easy steps:
-
Open an account, or log in if you’re already a customer
• Open an account in the UK
• Open an account in Australia
• Open an account in Singapore
- Search for the market you want to trade in our award-winning platform
- Choose your position and size, and your stop and limit levels
- Place the trade
Latest market news
Yesterday 01:32 PM
Yesterday 09:35 AM
Yesterday 07:23 AM
Yesterday 04:48 AM
Yesterday 12:17 AM
July 25, 2024 10:39 PM
Latest Trade Ideas articles

Yesterday 09:35 AM

Yesterday 12:17 AM

July 25, 2024 10:39 PM

July 25, 2024 05:30 PM