


Traders have certainly seen a lot more action than what is usually expected from the US summer months. But that doesn’t mean it is set to continue indefinitely, especially with a lack of top-tier news from the US and the Fed entering a blackout period ahead of next week’s FOMC meeting. And that can lead to some choppy trading conditions and markets be confined to ranges. So what better time is there to take a step back and look at the bigger picture for key levels to trade around? In today’s piece, we look at potential opportunities on the Dow Jones, ASX 200 and Hang Seng charts.
The ASX wobbles on its perch after RBA mins
The RBA released their July minutes which were a tad more hawkish than their July statement let on. Whilst they clearly opted to hold rates, the RBA minutes have served as a timely reminder that the RBA could still hike at their next meeting, depending on which way the incoming data swings and its impact on staff forecasts. Of particular interest will be Thursday’s employment report and the monthly and quarterly inflation reports next week where hot prints keep the pressure on for another hike.
And this has seen the ASX 200 pull back to a 2-day low, as some investors are clearly questioning if they want to be perched at these highs following the minutes.
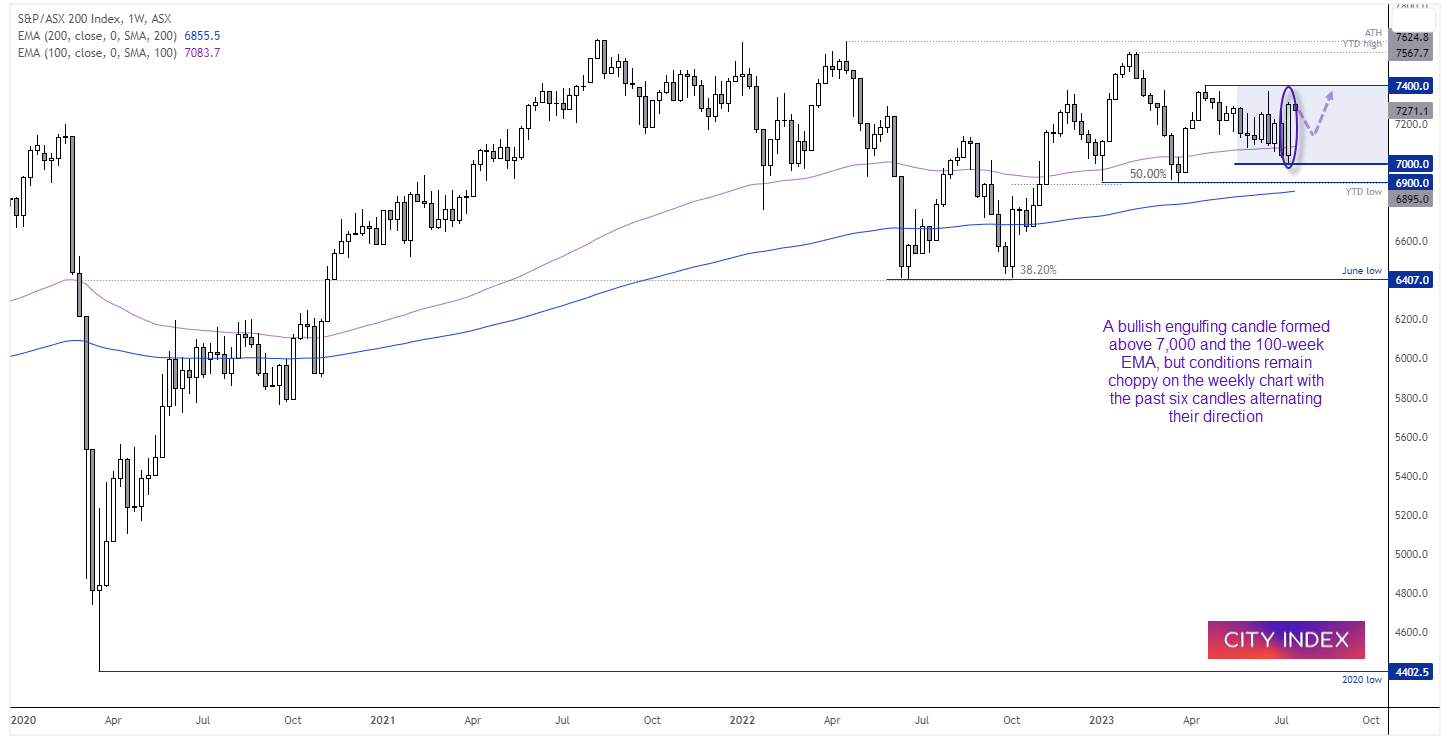
ASX 200 weekly chart:
If we look at the weekly chart, the ASX 200 has not been the prettiest out there. Whilst the market held above 7,000, the weekly direction has alternated over the past six candles. However, last week’s bullish engulfing candle does provide some hope that momentum is vying for a break higher in line with the March rally, but that still leaves some room for a pullback first.
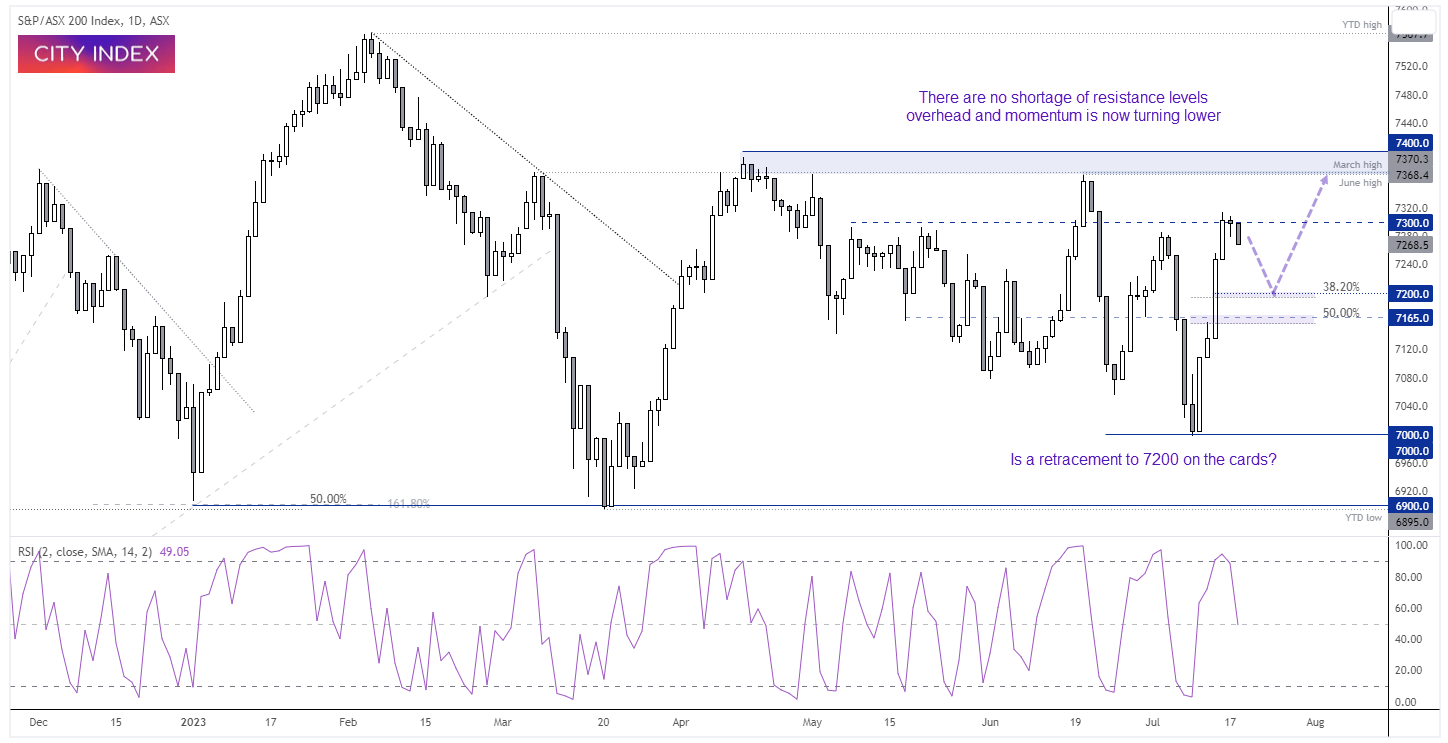
ASX 200 daily chart:
With no shortage of resistance levels overhead and the RSI (2) having reached the overbought zone, we think a pullback is on the cards. And given the choppy nature of price action over previous weeks, a move down to 7200 does not seem unreasonable. This could provide bears with an opportunity to fade into moves below last week’s high and target the 7200 handle near the 38.2% Fibonacci level (the 50% level is also viable near 7165). Bulls may want to step aside and seek evidence of a swing low around 7200 before considering longs towards 7300 ( a break above which brings the highs around 7400 into focus).
Dow Jones rises to a YTD high (but I’m sceptical of a strong breakout)
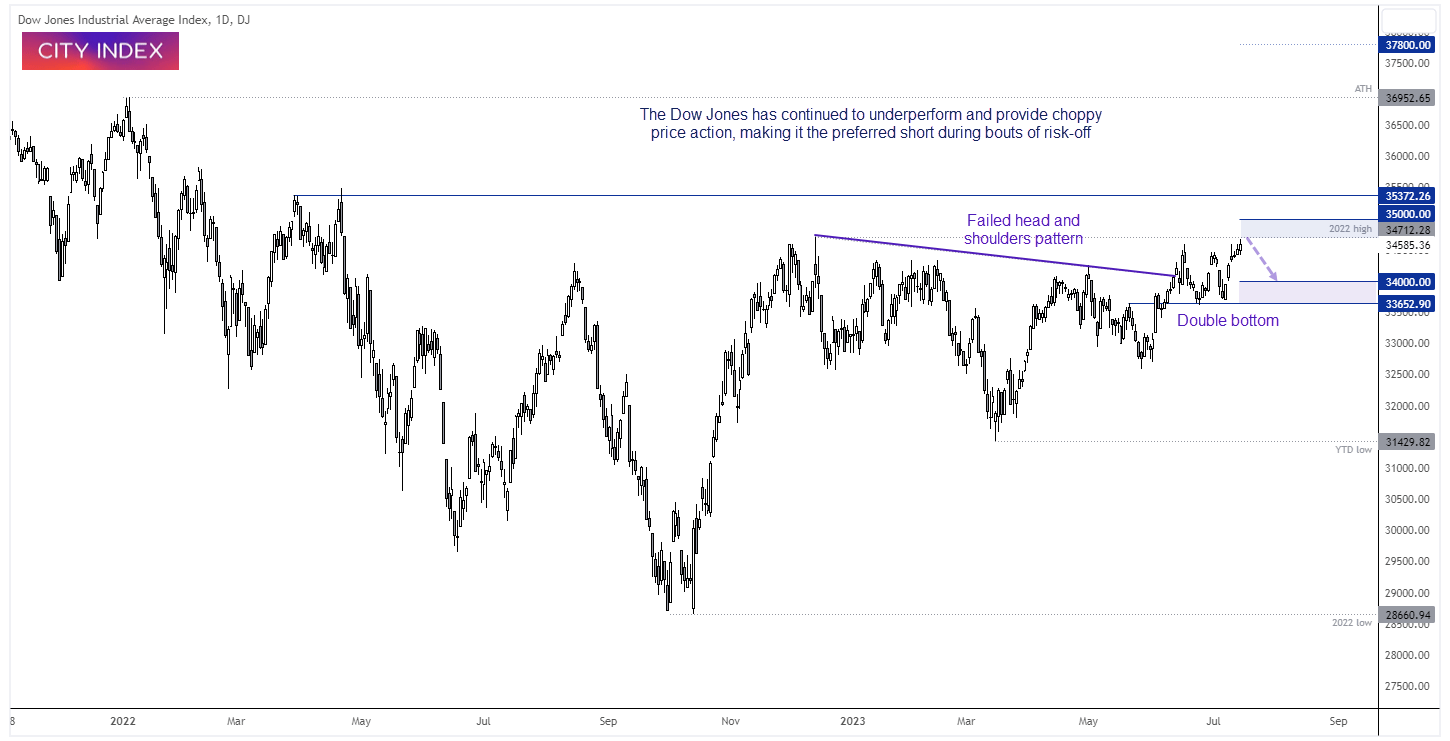
In last month’s article I highlighted a potential inverted head and shoulders pattern on Dow Jones. Yet the supposed ‘breakout’ of the sloping neckline lacked conviction and the subsequent choppy sideways range has invalidated the pattern in my personal view. With that said, how necklines are drawn brings a lot of ambiguity for this type of pattern which makes them quite difficult to trade. But a key characteristic of a H&S breakout is that it must be strong and well defined. This means if we were to choose a break of the 2022 high to confirm the pattern, it would need to be soon and convincingly strong.
The daily chart shows a double bottom around 33,650 and prices are now close to testing the 2022 high. Yesterday’s high wick shows a slight hesitancy to break immediately higher, and that may turn out to be the case given we’re in July (a month generally known for its low levels of volatility and trading volume).
Furthermore, given its lacklustre performance overall and key resistance levels between 35k and 35,500, we suspect a pullback form current levels seems more likely than a breakout. Bears could wait for a bearish day candle to form then seek a near-term short entry with a stop above the recent swing highs, with a view to target 34,000.
The Hang Seng is trying to turn its bearish ship around
Economic data in China has continued to disappoint and expectations for return are also diminishing. And with weak data comes calls for more economic stimulus. Whether it will be enough to spark a true risk-on rally for equity markets remains debatable, but what we’re focusing on is that the Hang Seng remains supported despite the weaker data, which leaves the potential for at least a bounce higher over the coming weeks.
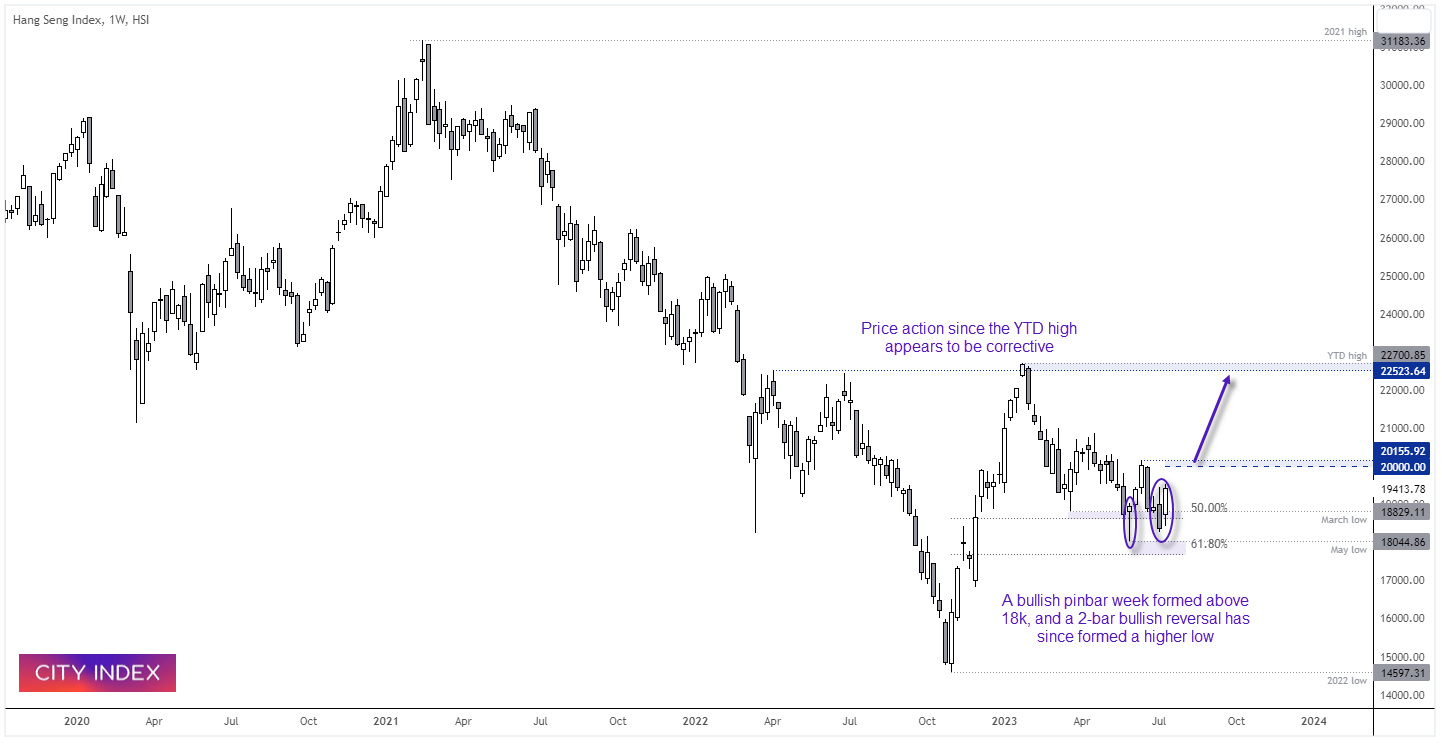
We can see on the weekly chart that the Hang Seng posted a strong rally late October and formed a V-bottom low (which can be associated with significant lows). The rally was in a relatively straight line until the late January high, and prices have since pulled back in a corrective fashion. A bullish hammer week formed at the end of May above the 61.8% Fibonacci ratio, and a lower high has since formed followed by a bullish candle last week.
We see dips towards last week’s lows as an opportunity for bulls to consider longs, in anticipation of a break above 20k / the 20,155 high. The next target for bulls to consider would be around 22k, just below the YTD high.
-- Written by Matt Simpson
Follow Matt on Twitter @cLeverEdge
How to trade with City Index
You can trade with City Index by following these four easy steps:
-
Open an account, or log in if you’re already a customer
• Open an account in the UK
• Open an account in Australia
• Open an account in Singapore
- Search for the market you want to trade in our award-winning platform
- Choose your position and size, and your stop and limit levels
- Place the trade
Latest market news
Yesterday 01:32 PM
Yesterday 09:35 AM
Yesterday 07:23 AM
Yesterday 04:48 AM
Yesterday 12:17 AM
July 25, 2024 10:39 PM
Latest Trade Ideas articles

Yesterday 09:35 AM

Yesterday 12:17 AM

July 25, 2024 10:39 PM

July 25, 2024 05:30 PM