


BP swings into profit
Upbeat results from BP, are lifting the oil major and the FTSE
BP swung into profit amid surging oil and gas prices. Underlying replacement cost profit for 2021, a proxy for net profit reached $12.8 billion, up from a loss of $5.7 billion last year and ahead of consensus estimates of $12.5 billion.
In the fourth quarter net profit of $4.1 billion was recorded, above forecasts of $3.9 billion.
Oil prices are hovering around a 7-year high and gas prices rallied firmly in the final months of 2021.
The company also outlined plans to buy back $8.5 billion in shares in the first half of the year and said it expects to increase dividends by 4% to $0.25 per share in Q1.
Stock market hoursWhere next for the BP?
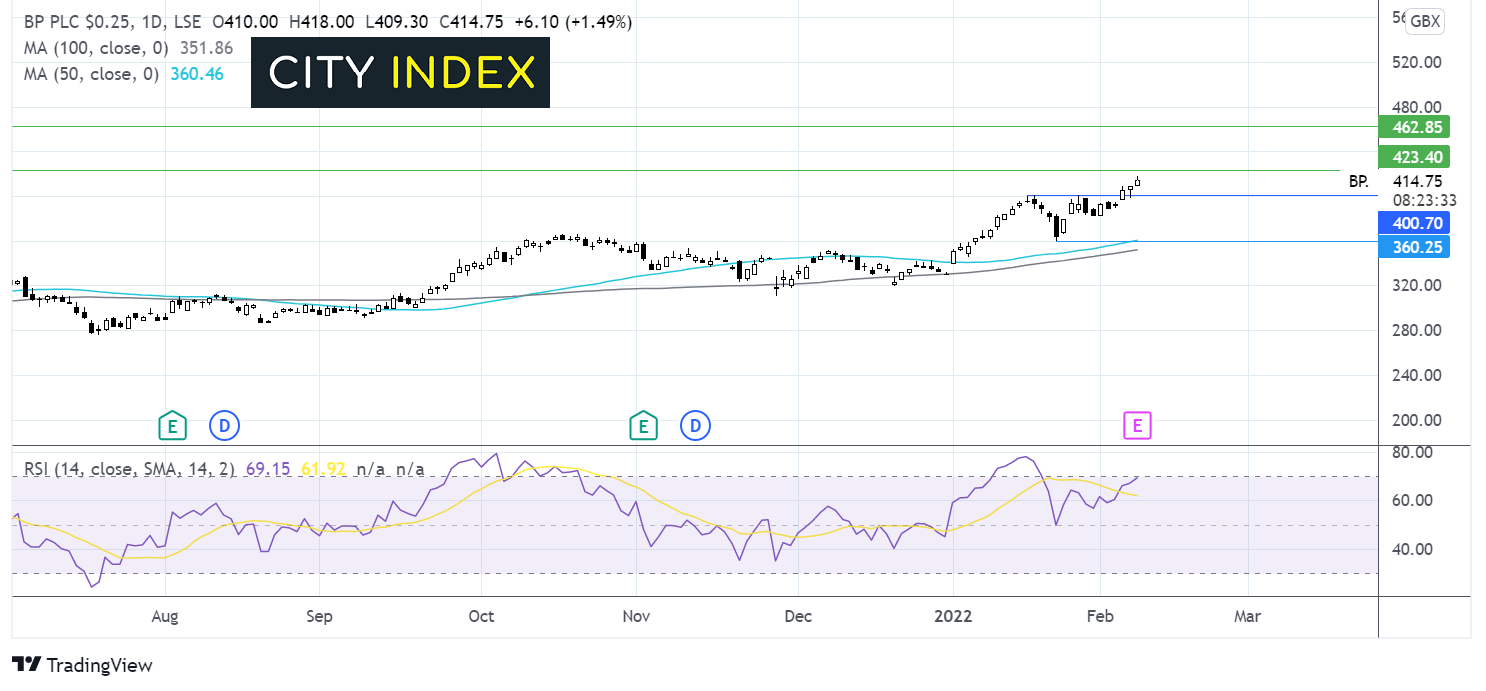
BP trades 26% higher so far this year but remains below its pre-pandemic levels as it transitions to a greener outfit.
The share price trades above its 50 & 100 sma, and the RSI is supportive of further gains whilst is remains out of overbought territory.
Resistance can be seen at 426p a high from February 2020 and 460p the March 2020 high.
On the flip side, a move below 400p the psychological level and mid-January high could negate the near term uptrend, whilst a move below 360p the January 24 low and 50 sma is needed for sellers to gain momentum.
Oil steady ahead of API
Oil prices are edging lower for a third straight day, edging away from the recent 7-year highs. Oil prices are coming under mild pressure as attention turns towards US – Iran nuclear talks and the prospect of the release of Iranian oil back into the market.
Currently, sanctions imposed on Iran prevent its oil from being legally exported. Progress in US – Iran talks could see those sanctions lifted and oil supply levels rise considerably.
Tight supply and fears of supply disruption should Russia invade Ukraine have boosted oil prices even after OPEC+ said it would raise output quotas.
API inventory data is due late, a draw of -1.645 million barrels was recorded last week.
Learn more about trading oilWhere next for oil prices?
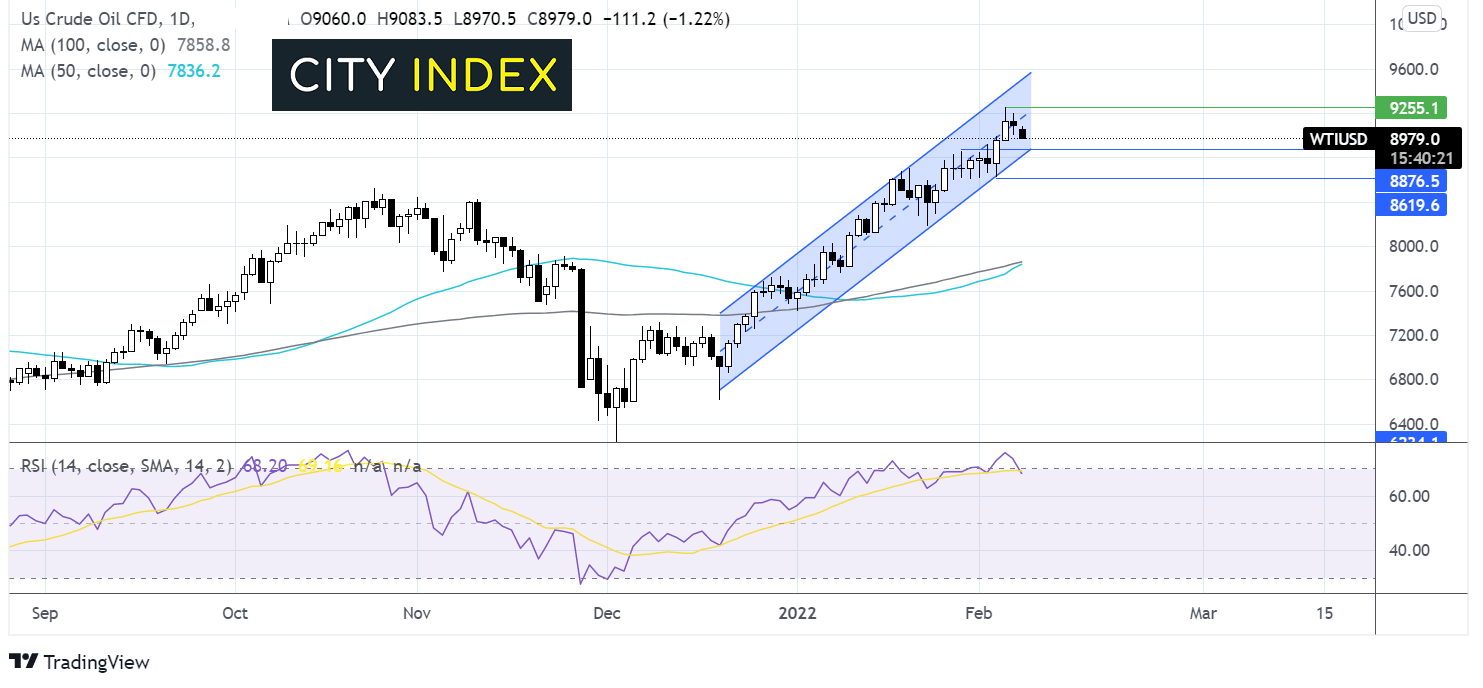
WTI oil continues to trade in a rising channel dating back to mid-December. It trades above its 50 & 100 sma and the 50 sma is crossing above the 100 in a bullish signal.
The price ran into resistance at 92.50 when the RSI moved into overbought territory so we could see some consolidation around these levels or even a move lower to bring the RSI out of overbought territory.
Support can be seen at $88.50 horizontal support and the lower band of the rising channel and the $86.20 the February 3 low.
On the upside, resistance sits at $92.50 the recent 7 year high ahead of 94.50 the upper band o the rising channel.
How to trade with City Index
Follow these easy steps to start trading with City Index today:
- Open a City Index account, or log-in if you’re already a customer.
- Search for the market you want to trade in our award-winning platform.
- Choose your position and size, and your stop and limit levels
- Place the trade.
Latest market news
Yesterday 01:32 PM
Yesterday 09:35 AM
Yesterday 07:23 AM
Yesterday 04:48 AM
Yesterday 12:17 AM
July 25, 2024 10:39 PM
Latest Commodity articles

January 8, 2024 11:51 PM

May 30, 2023 02:30 PM

June 10, 2022 12:26 PM

June 6, 2022 07:22 AM