


June 15, 2022 5:23 AM

Reformulated Blendstock for Oxygenate Blending, or RBOB (pronounced R-BOB), Gasoline Futures have been on the minds of many people lately. RBOB has been moving aggressively higher since December 2, 2021 when the futures product made a low of 1.8799. Since then, RBOB has been on the rise. On June 6th, it made a high print of 4.3260, more than double the price of December 2nd. Recently, RBOB has been moving higher in an ascending wedge pattern. Expectations are that price will break lower out of an ascending wedge as price moves towards the apex (which currently looks like the end of August). RBOB traded to the 127.2% Fibonacci extension from the high of March 7th to the low of March 15th, near 4.2017. Could it continue higher? First resistance is at the highs of June 6th at 4.3260, then the 161.8% Fibonacci extension from the same timeframe near 4.5596. However, if price moves lower, horizontal support is at 3.8960. Below there, RBOB can fall to the 50 Day Moving Average at 3.6511, then the bottom upward sloping trendline of the wedge, near 3.55.
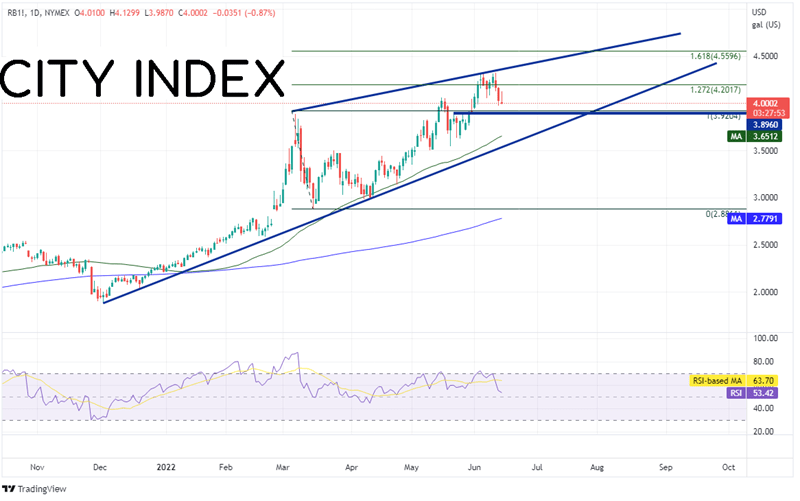
Source: Tradingview, NYMEX
Many traders would like to take advantage of the moves in RBOB Gasoline Futures, however it may not be available to them. RBOB has a high positive correlation with AUD/JPY. The bottom panel of the chart below shows the correlation between RBOB and AUD/JPY. Notice that since the beginning of June, the 2 assets have had a positive correlation. More recently, there has been a very high positive correlation, with a correlation coefficient of +0.96! Correlations of +1.00 are considered perfect positive correlations and the 2 assets move together 100% of the time. +0.96 is pretty close.
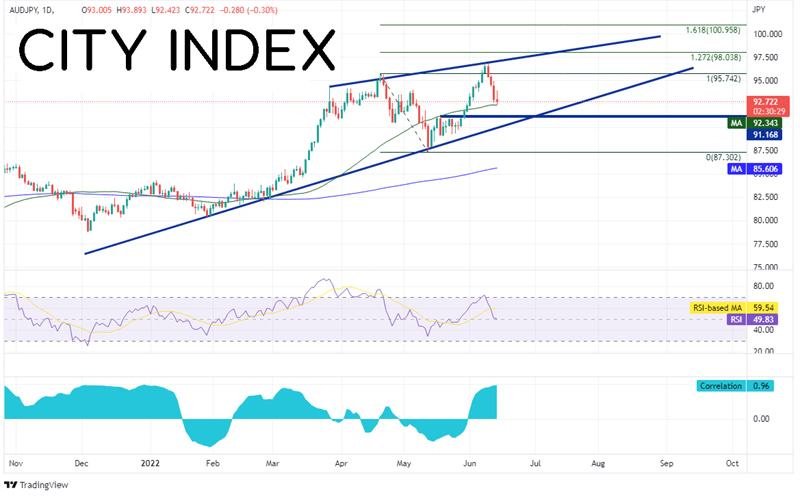
Source: Tradingview, Stone X
Trade AUD/JPY now: Login or Open a new account!
• Open an account in the UK
• Open an account in Australia
• Open an account in Singapore
AUD/JPY also has been moving higher since early December 2021, and more recently, has formed an ascending wedge formation. On June 8th, the pair made a high of 96.88, taking out the previous high from April 20th at 95.75. Expectations are that the pair will trade lower out of the ascending wedge as it moves closer to the apex. If AUD/JPY continues higher, first resistance is at the June 8th high of 96.88, which is also the top trendline of the wedge. Above there, price can move to the 127.2% Fibonacci extension from the highs of April 20th to the lows of May 12th at 98.04 and then the 161.8% Fibonacci extension from the same timeframe near 100.96. However, the pair is currently trading just above the 50 Day Moving Average at 92.34. If AUD/JPY breaks below, horizontal support is at 91.17, then the bottom trendline of the wedge near 90.00. Below there, price can fall to the lows of May12th at 87.30.
RBOB Gasoline Futures have a high, positive correlation with some of the Yen pairs, including AUD/JPY. NZD/JPY, CAD/JPY and EUR/JPY have similar correlations above +0.90. Therefore, if one doesn’t have access to trade RBOB, a highly correlated yen pair is another option for traders, as long as the correlations stay high.
Learn more about forex trading opportunities.
Latest market news
Yesterday 01:32 PM
Yesterday 09:35 AM
Yesterday 07:23 AM
Yesterday 04:48 AM
Yesterday 12:17 AM
July 25, 2024 10:39 PM
Latest Forex articles

Yesterday 12:17 AM

July 25, 2024 10:39 PM

July 25, 2024 03:59 PM

July 25, 2024 04:37 AM