


Up until yesterday’s high, things were going well for the oil rally. Prices broke out of a tight consolidation on Thursday thanks to a weaker US dollar and a large drawdown of inventories as US ‘driver season’ was underway. News that China was indeed scaling back lockdown restrictions, alongside the EU’s failure to man up and ban Russian oil imports simply added to the long list of reasons to send oil higher. Yesterday the front-month futures contract broke to a 12-week high and came close to cracking $120 – but it didn’t.
News that some OPEC members were mulling over whether to remove Russia from their production caps saw a sharp reversal in oil prices. This raised concerns that the market could be hit with new supply, as the caps would no longer apply to Russia – a country that is reliant upon oil exports to fund its crumbling economy during a war with Ukraine. Whether this is enough to turn the tide against the multiple supporting factors behind oil’s rally (China reopening, EU embargo) is debatable. But it can also be argued that much of the drivers behind oil’s recent rally has been priced in. Regardless, we can see that some wind has been taken out of the oil rally sails.
With that said we do have the OPEC+ meeting tomorrow. For us to see any sizeable pullback then OPEC will likely have to increase production above the expected 432k bpd. Yet Russia’s expulsion and the potential for other oil cartels to increase production also need to be factored in.
How to start oil trading
WTI daily chart:
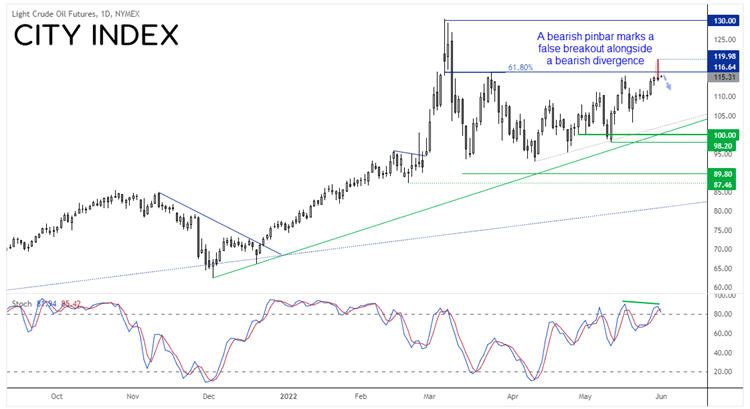
Yesterday’s impressive gains were quickly erased as prices fell back below the key breakout level of 116.64 – which effectively means we saw a ‘fakeout’ at resistance. A bearish divergence has also formed with the stochastic oscillator, which shows momentum was waning at these highs. So whilst prices remain beneath 116.64, we may see another dip lower before buyers step back in.
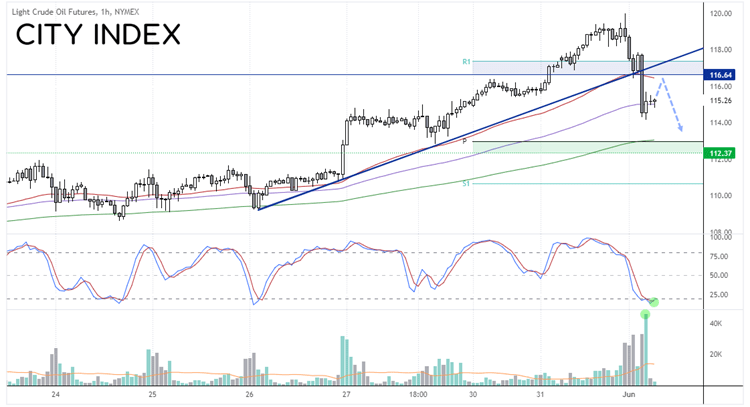
WTI 1-hour chart:
The hourly chart shows a trendline break before support was found at the 100-hour eMA. A bullish candle formed with high volume, and the stochastic oscillator generated a buy signal. We therefore suspect a countertrend rally to 116 before prices create a swing high and move back towards 113, near the 200-hour eMA and weekly pivot point.
How to trade with City Index
You can easily trade with City Index by using these four easy steps:
-
Open an account, or log in if you’re already a customer
• Open an account in the UK
• Open an account in Australia
• Open an account in Singapore
- Search for the company you want to trade in our award-winning platform
- Choose your position and size, and your stop and limit levels
- Place the trade
Latest market news
Yesterday 01:32 PM
Yesterday 09:35 AM
Yesterday 07:23 AM
Yesterday 04:48 AM
Yesterday 12:17 AM
July 25, 2024 10:39 PM
Latest Technical Analysis articles

July 25, 2024 03:59 PM

July 24, 2024 07:26 PM

July 24, 2024 09:55 AM

July 23, 2024 11:58 AM