


- Nasdaq 100 analysis: Jobless claims rise more than expected
- UoM surveys due on Friday and CPI next week
- Nasdaq 100 technical analysis remains positive for now

Nasdaq 100 analysis: Jobless claims rise more than expected
US stocks, gold and bonds all rose as the dollar fell after the latest jobless claims data provided fresh evidence of a cooling US labour market, helping to support the view that the Federal Reserve is going to cut rates by around September. Claims for unemployment benefit rose to 231K vs, 212K expected, up sharply from 209K the previous week. This comes after the Bank of England’s dovish rate hold sent the FTSE to its 6th record in as many days. So, the Nasdaq 100 analysis remain positive even if the bullish momentum has slowed somewhat.
Earlier in the day, US futures were slightly weaker with investors happy to take profit as the earnings season wraps up and not much to look forward to on the macro calendar, apart from those jobless claims figures.
Until new inflation data is released next week to help gauge when there might be a shift towards lower interest rates, don’t be surprised to see some side-ways action in major indices like the Nasdaq. We have heard from a few Federal Reserve officials this week, all suggesting that interest rates may need to remain at these high levels for a longer period than previously anticipated in order to moderate demand and alleviate inflationary pressures. Still, the lack of any major bearish catalysts could keep the downside limited.
Why have stocks risen in recent days?
Today’s gains come after a two-day pause in the sizeable rally that commenced in the second half of last week. This was driven by various factors, including better-than-expected earnings, weaker US data to help increase the odds of a rate cut and an announcement from the Fed that it would taper its balance sheet runoff to $25 billion from the current monthly pace of $60 billion in Treasurys. In effect, the Fed will not be removing a good $35 billion in liquidity every month compared to before. This, along with a weaker jobs report and disappointing ISM surveys, all helped to suppress bond yields and underpinned stocks. The weaker macro releases also helped to boost the odds of a Fed interest rate cut by September to around 70% from 58% before. Lower interest rates make stocks more attractive. How? Well, consider the opposite: higher rates are not only a direct cost on businesses that borrow money, they also raise the opportunity cost of holding equities over government bonds that provide a higher yield when rates are high.
Corporate news
It has been a good season for Corporate America, but now that Q1 reporting season is at its twilight. Of the 424 S&P 500 companies that have reported their results, a good 78% have beaten analysts' expectations. Typically, this rate is around 67%.
That said, the latest results from Arm Holdings and Airbnb were not great. Intel saw its shares dropped after the US revoked licenses that allowed the firm to sell chips to Huawei Technologies.
UoM surveys due on Friday and CPI next week
It has been a quiet week for US data, especially following the recent Fed policy decision, NFP, and other economic indicators. Apart from today’s earlier release of the weekly jobless claims data, the only other notable event on the US economic calendar is on Friday at 15:00 BST, when the University of Michigan releases its consumer sentiment and inflation expectations surveys.
University of Michigan’s Inflation Expectations survey will be in focus on Friday. It has climbed steadily from 2.9% in January to 3.2% in April. With recent economic data weakening, will inflation expectations also ease?
The UoM will also release its consumer sentiment data simultaneously, potentially overshadowing the inflation expectations survey. This gauge has disappointed expectations recently and is expected to print 76.3 compared to 77.2 previously.
But the key macro highlight – CPI – in not due until next week. Ahead of CPI on Wednesday, we will have seen the latest PPI figures the day before. Together, the PPI and CPI data for April have the potential to intensify or reduce inflation concerns significantly depending on the direction of the surprise. CPI has consistently beaten expectations since the turn of the year. The Fed and stock market bulls will be hoping to see a softer print for a change, else rate cut expectations could be pushed out further.
Nasdaq technical analysis and trade ideas
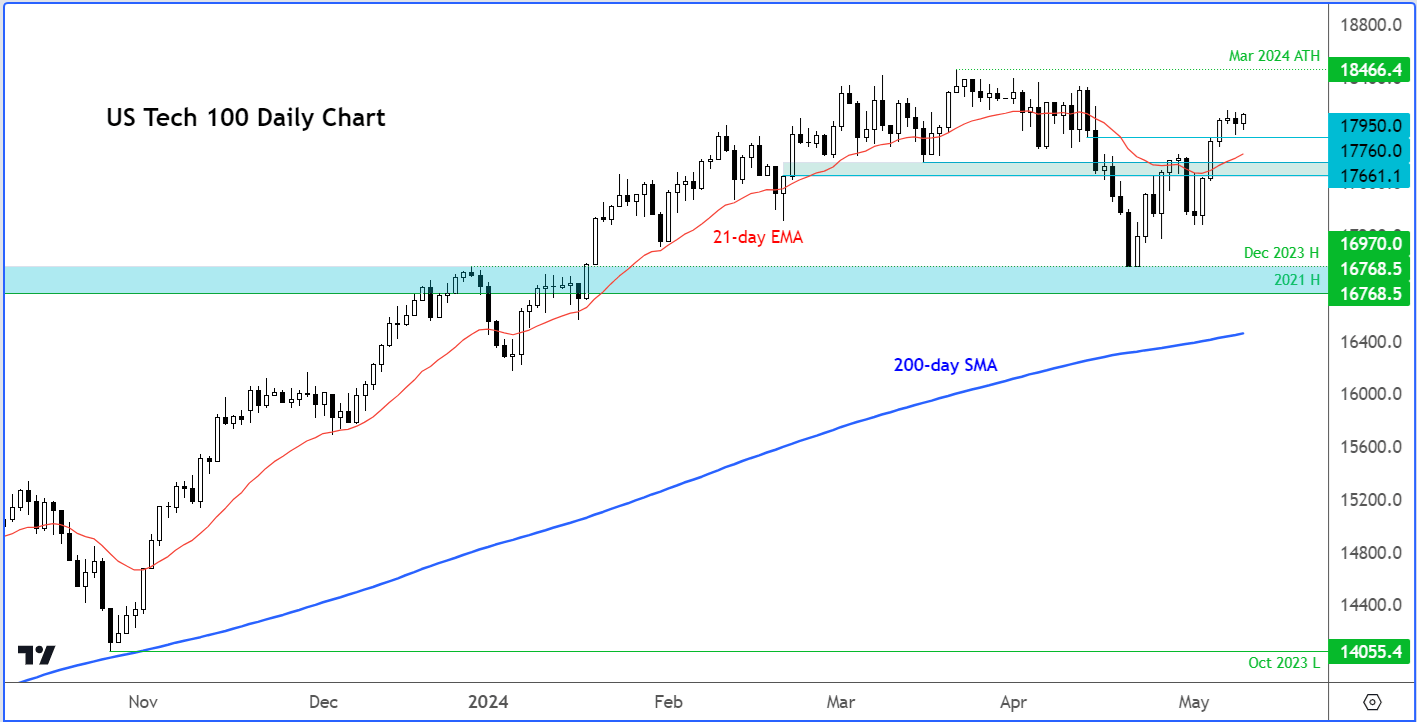
Source: TradingView.com
The trend remains bullish on the Nasdaq Index, although the momentum seems to have slowed somewhat. So, a bit of a pullback should not come as surprise, especially as we don’t have a lot to look forward to from both the economic and earnings calendars.
Among the key levels to watch include the 17660-17760 range on the downside. This area served as support in February, before breaking down in mid-April, and then offered resistance on a couple of occasions that month. The bulls took control of price action again at the start of this month, driving the index above this area to invalidate the bearish bias.
But if we go below the abovementioned zone again, this would be a bearish outcome in my view, which could pave the way for a bigger correction.
Meanwhile on the upside, short-term resistance comes in around 18150. A close above this level could see the index take out the March all-time high of 18466.
-- Written by Fawad Razaqzada, Market Analyst
Follow Fawad on Twitter @Trader_F_R
How to trade with City Index
You can trade with City Index by following these four easy steps:
-
Open an account, or log in if you’re already a customer
• Open an account in the UK
• Open an account in Australia
• Open an account in Singapore
- Search for the company you want to trade in our award-winning platform
- Choose your position and size, and your stop and limit levels
- Place the trade
Latest market news
Today 09:41 AM
Yesterday 08:00 PM
Yesterday 02:00 PM
Latest US Tech 100 articles


April 28, 2024 08:00 AM

April 25, 2024 03:09 PM

April 16, 2024 08:00 PM