


Israeli Shekel, USD/ILS, Gold, Oil Talking Points:
- The week has opened with a breakout in the USD/ILS pair as Israel has declared war following a surprise attack from Gaza.
- USD/ILS was already holding in a bullish trend and this week’s open showed a strong breakout in the pair. While the move has moderated at this point, a key point of resistance sits overhead at the 4.00 handle.
- There have been a number of related macro moves with the rise in geopolitical tensions. Gold prices extended their Friday rally and oil prices gapped-higher to begin this week’s trade. Each market is addressed a little later in this article.
The world awoke to the possibility of war over the weekend. Much has been said in the media and surely much more will develop, but the aim for this article is to focus on financial market repercussions, starting with the USD/ILS pair and then moving on to related macro markets and themes. As such, the predominant focus of the text will revolve around the technical analysis of the matter in the effort of focusing on forward-looking strategy.
At the close of last week, the US Dollar had finally relaxed a bit following a blistering bullish run that entailed 11 consecutive weekly gains. That streak finally came to an end last week, even with a strong NFP report being issued on Friday morning. That data seemed to only extend the pullback, however, highlighting how the USD had become overbought from a few different vantage points; and the week finished with the greenback sticking very close to a key support level, as I had written at the time.
But matters can change very quickly, and geopolitics can certainly be a significant driver of change. Following news of rising tensions over the weekend markets opened with gaps in multiple areas, the US Dollar included. The Israeli Shekel has pushed down to a fresh seven-year low against the US Dollar on the back of this theme, with the USD/ILS pair making a fast run at the 4.00 psychological level. On the below monthly chart, we can see where this level has had some historical importance in the pair as a spot of prior support-turned-resistance; but a level that hasn’t traded since April of 2015.
USD/ILS Monthly Price Chart
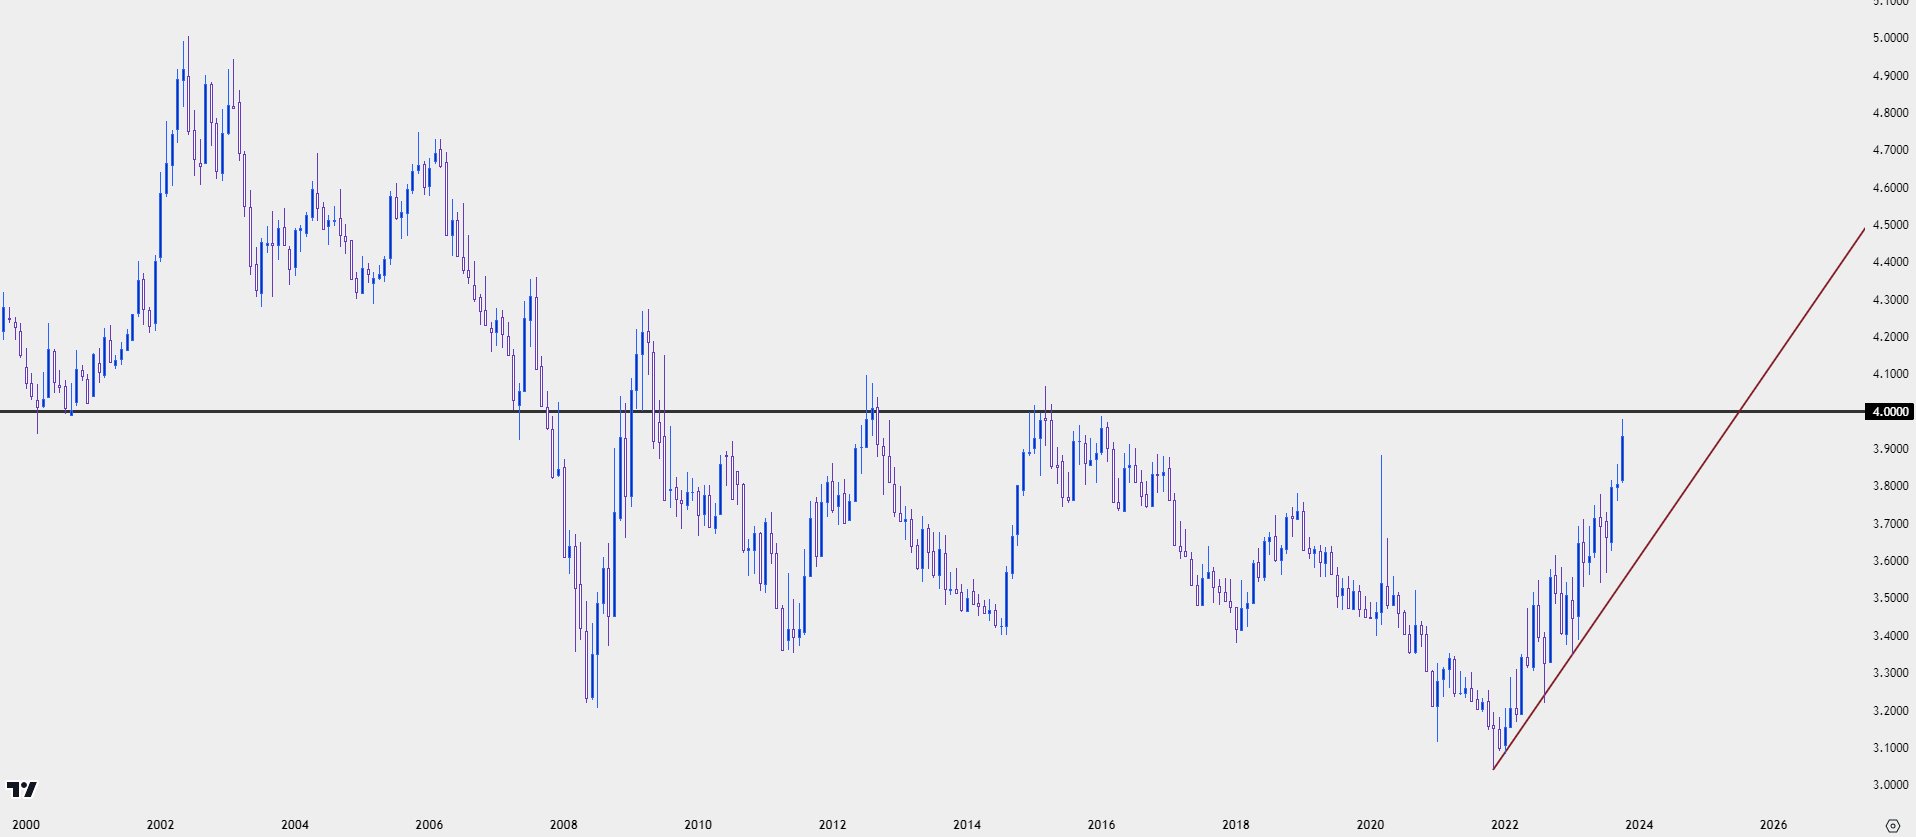 Chart prepared by James Stanley, USD/ILS on Tradingview
From the daily chart, we can get a better view of the breakout that showed up this morning along with some technical points that can be used for strategy moving forward.
The 4.00 handle looming overhead could be considered as key resistance given that it’s a major psychological level that hasn’t traded in more than eight years. This could also be a reason why the breakout slowed this morning, with such a major waypoint coming into view. This could also produce challenge for those looking to chase the breakout.
Ahead of this break, there was a bullish breakout setup, taking the form of an ascending triangle. This is key because the resistance from that setup can now become support potential for bullish trend continuation, and that plots around 3.8665. Below that, the 3.75 level was in play previously as support and before that, the 200-day moving average had held two separate support tests earlier in the summer.
USD/ILS Daily Chart
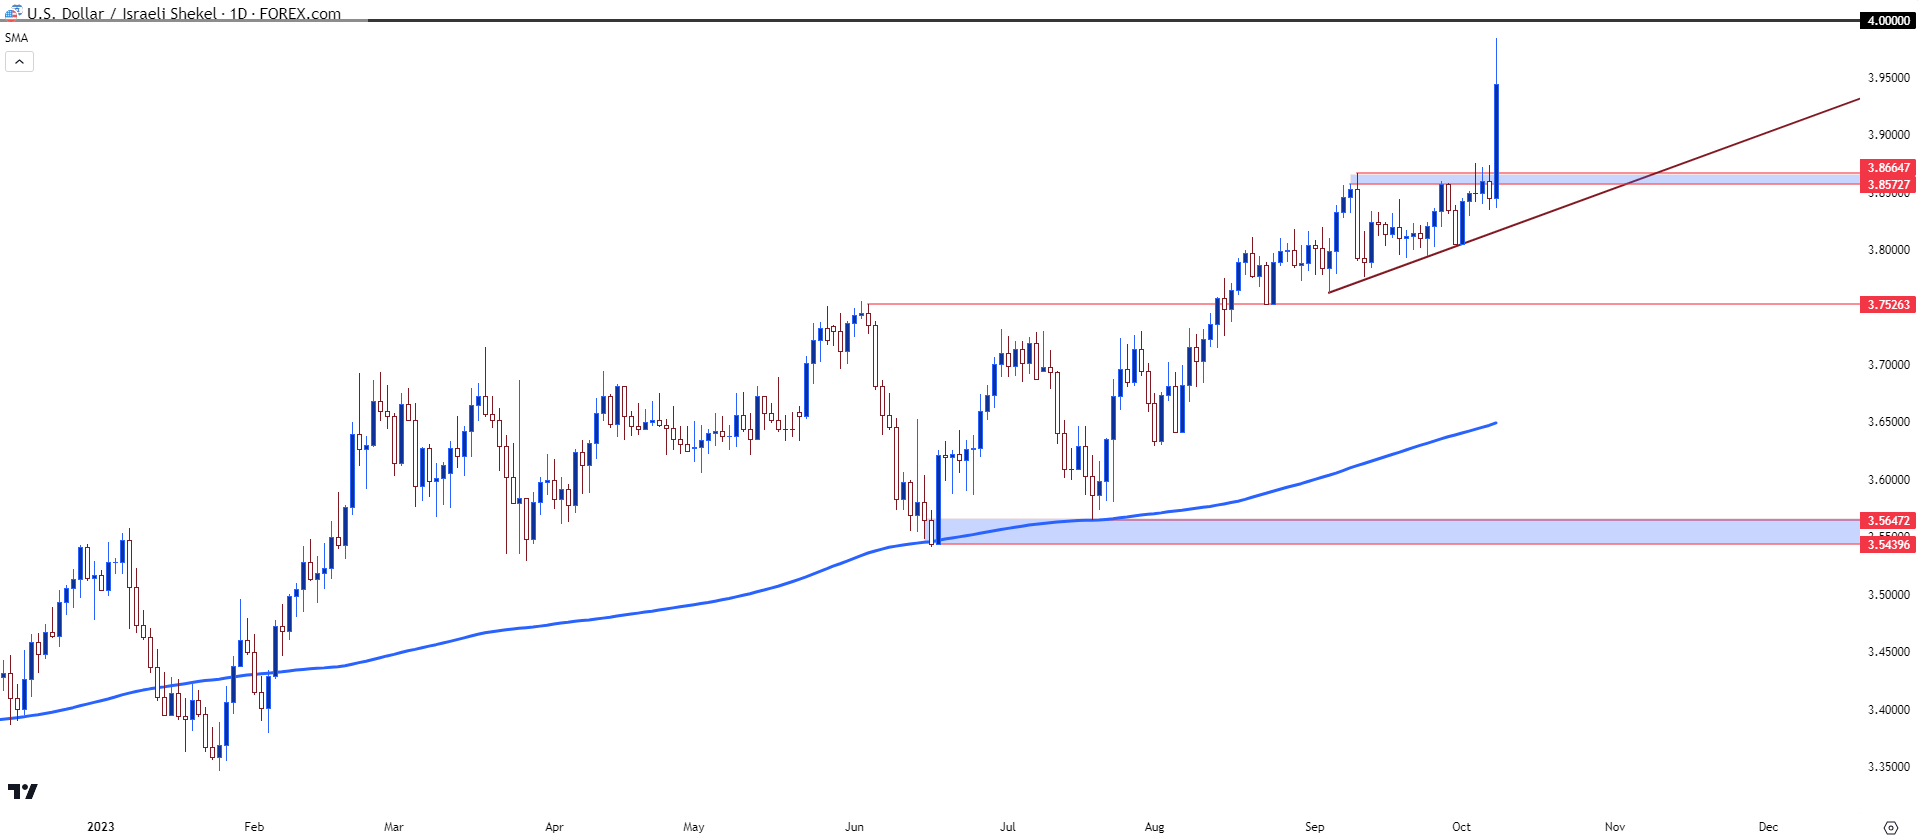 Chart prepared by James Stanley, USD/ILS on Tradingview
USD/ILS Shorter-Term
Shorter-term analysis in the USD/ILS pair remains quite volatile after the weekly open. The initial breakout ran from below 3.85 all the way up to 3.98 before cooling, and the entire move was retraced around midnight ET before prices bounced back up. This highlights how dangerous the short-term backdrops can be during such market themes.
USD/ILS Hourly Chart
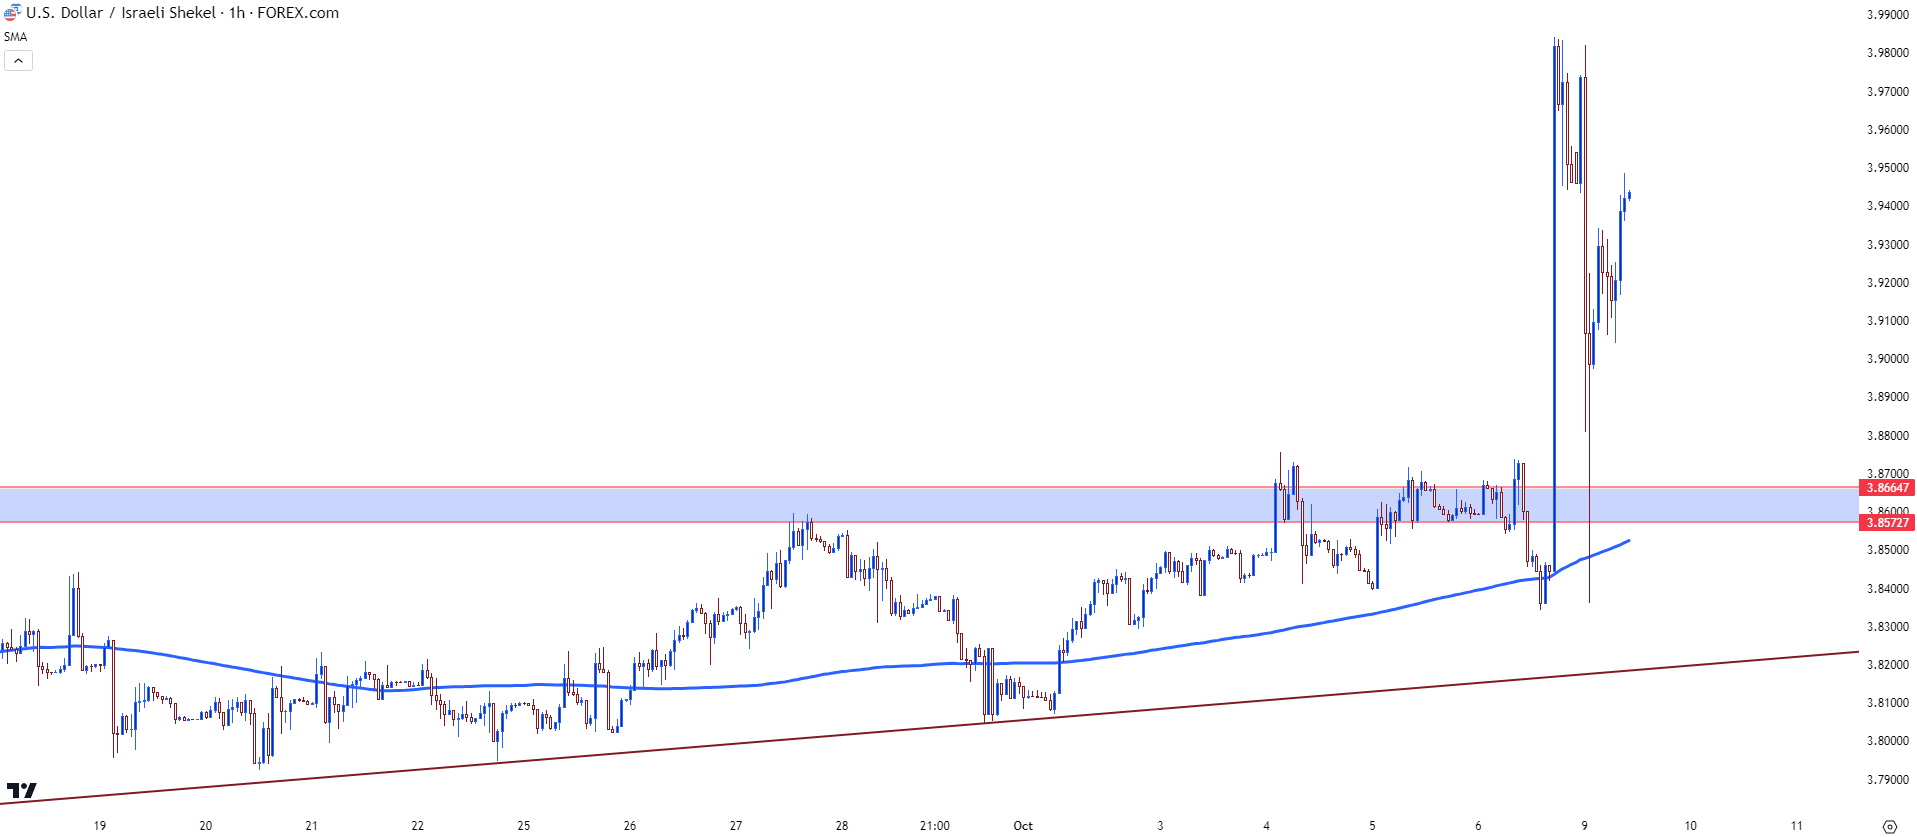 Chart prepared by James Stanley, USD/ILS on Tradingview
US Dollar Trendline Support
The US Dollar broke its streak of 11 consecutive weekly gains last week, even despite a blowout NFP report that was released on Friday. This speaks to just how overbought the currency was coming into last week, which went along with related matters of oversold readings in both gold and EUR/USD. But the rise in tensions to kick off this week’s trade has helped to build a bounce in the Greenback and the question remains as to whether there’s more pullback left to be seen or whether that theme will be cut short given the rise in tensions.
Gold and EUR/USD showed relief rallies on Friday after that NFP report and that helped the US Dollar to pullback to support at a bullish trendline. That trendline held the lows into the end of the week, but whether the bullish trend is already ready for continuation remains of question, as we’ve already seen short-term resistance hold at a spot of prior support, plotted from around 106.56.
That could possibly keep the door open for a deeper pullback, even with a rise in geopolitical tensions. From the four-hour chart below, we can see that sequencing of lower-lows and lower-highs intact, as of this writing. Last week’s low of 105.95 is the spot that bulls would need to defend to show a higher-low in order to start re-taking control of near-term price action. If they can’t hold above 105.95, then there’s another support zone just a bit lower, taken from 105.69-105.88. A show of buying support there could even keep the door open for bullish trends, but if buyers fail to hold the lows there then the scope for a deeper pullback increases, with focus then shifting to supports at 105.38 and 105.00.
US Dollar Four-Hour Price Chart (indicative only)
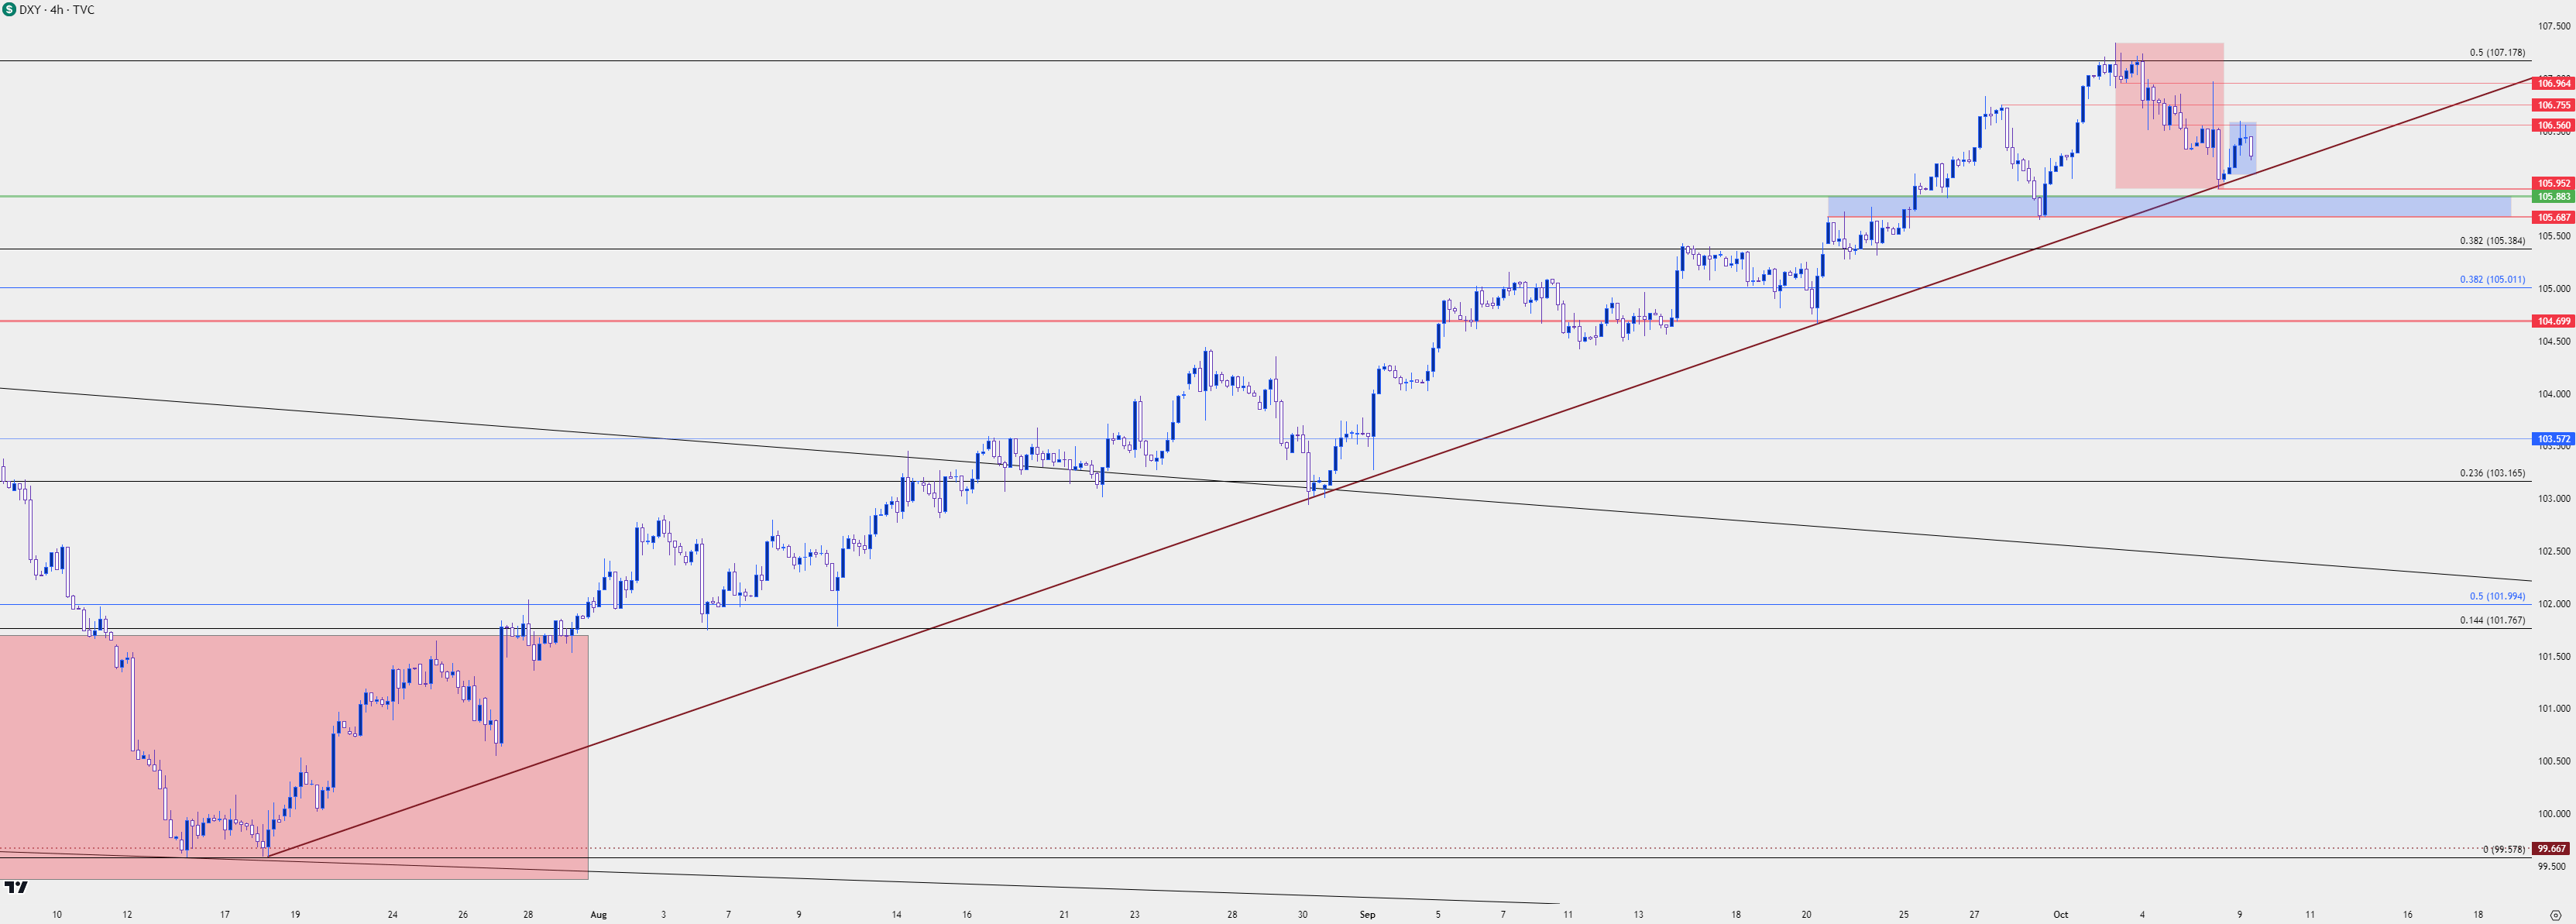
Chart prepared by James Stanley; data derived from Tradingview
Gold
Gold had went into a deep oversold state last week as qualified by Daily relative strength. The RSI indicator on the daily chart of spot gold dropped below the 20 level for only the fourth time in the past 22+ years. I wrote about that on Thursday as gold prices were holding very near the March lows, building a falling wedge formation in the process.
The NFP report brought an initial rush of USD-strength, but that soon dissipated and in gold, that led to a topside breakout. Bulls were still showing caution into last week’s close but after this week’s open, with a fresh flare of geopolitical tension, gold prices were able to extend that incline. At this point, gold has already taken out a couple of prior potential support levels, and those now become possible support. That plots in a zone from 1829-1833, with shorter-term Fibonacci levels around 1848 and 1837. If bulls can hold support at either 1837 or 1848 by the end of today’s trade the door will remain open to breakout continuation scenarios. The zone around 1830 becomes a decision point for bulls and if they fail to hold support above that level, the lows are at risk.
The big area of resistance sitting overhead is the spot that runs from 1880-1885.
Gold (XAU/USD) Four-Hour Price Chart
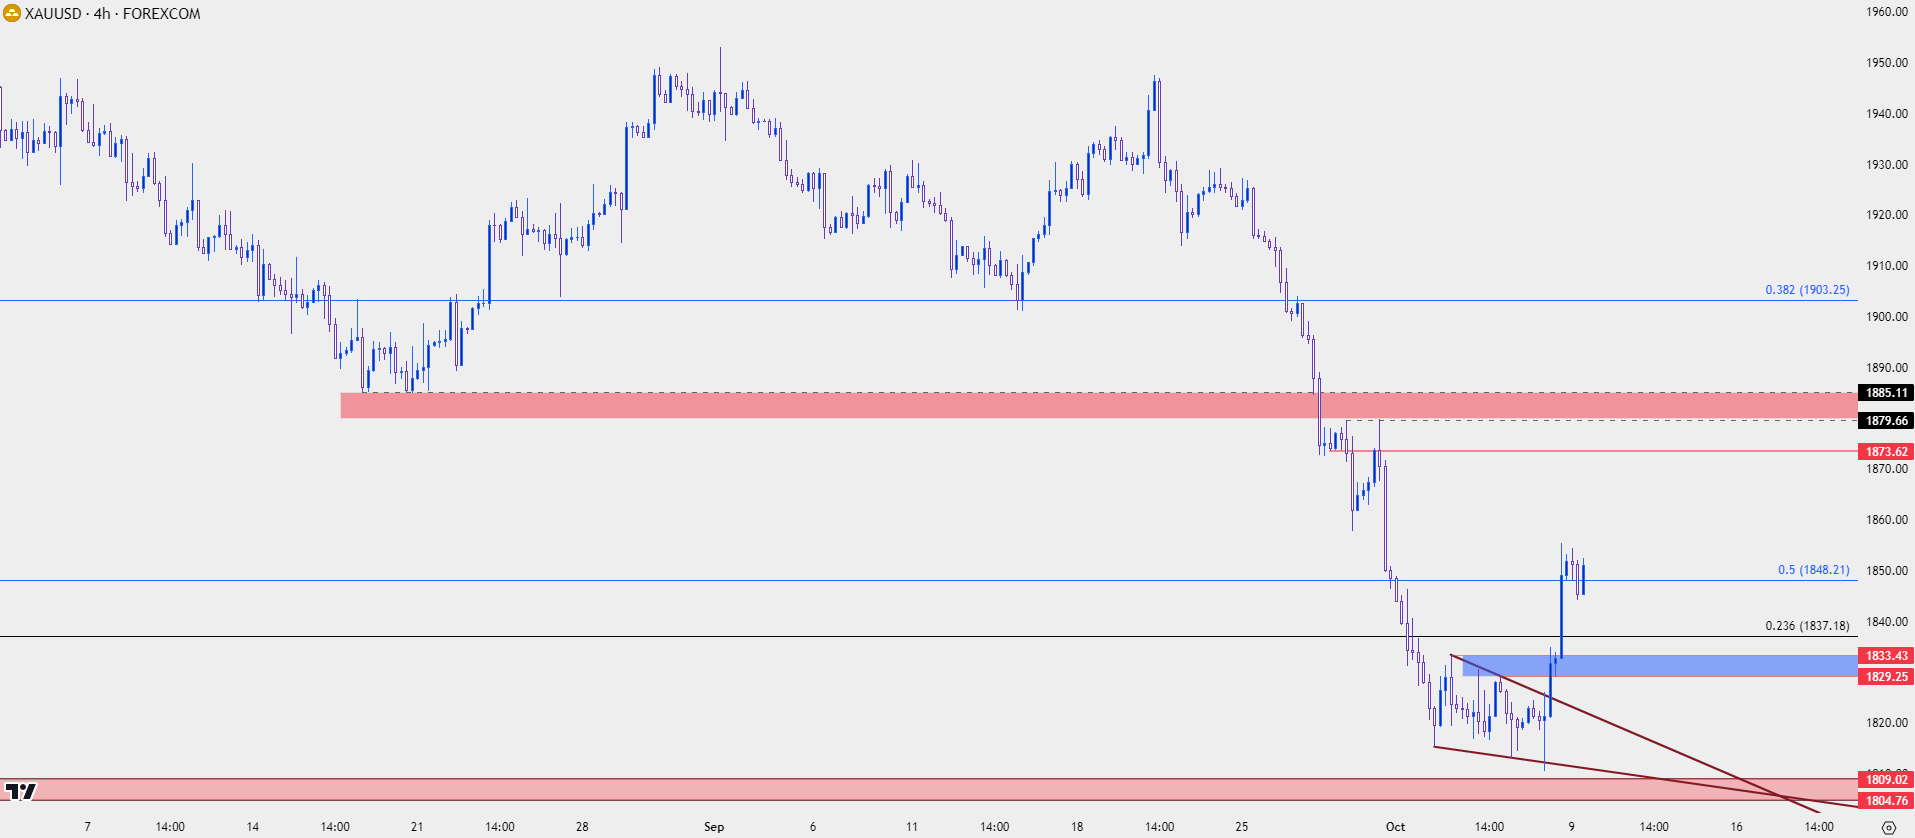 Chart prepared by James Stanley, Gold on Tradingview
Oil Prices Spike
One of the more notable items from last week was a rather dramatic drop in WTI crude oil prices. Just the week before, the bullish trend had extended to trade at the $95 handle for the first time in a year. But as markets were on edge and demand concerns were becoming more of a concern, oil prices shed more than 8% last week, with WTI testing a big zone of support in the 81.96-83.70 area.
This week’s open has seen prices gap-higher given the rise in geopolitical tensions, and from the weekly chart we can see this as a possible higher-low.
WTI Crude Oil Weekly Chart (indicative only)
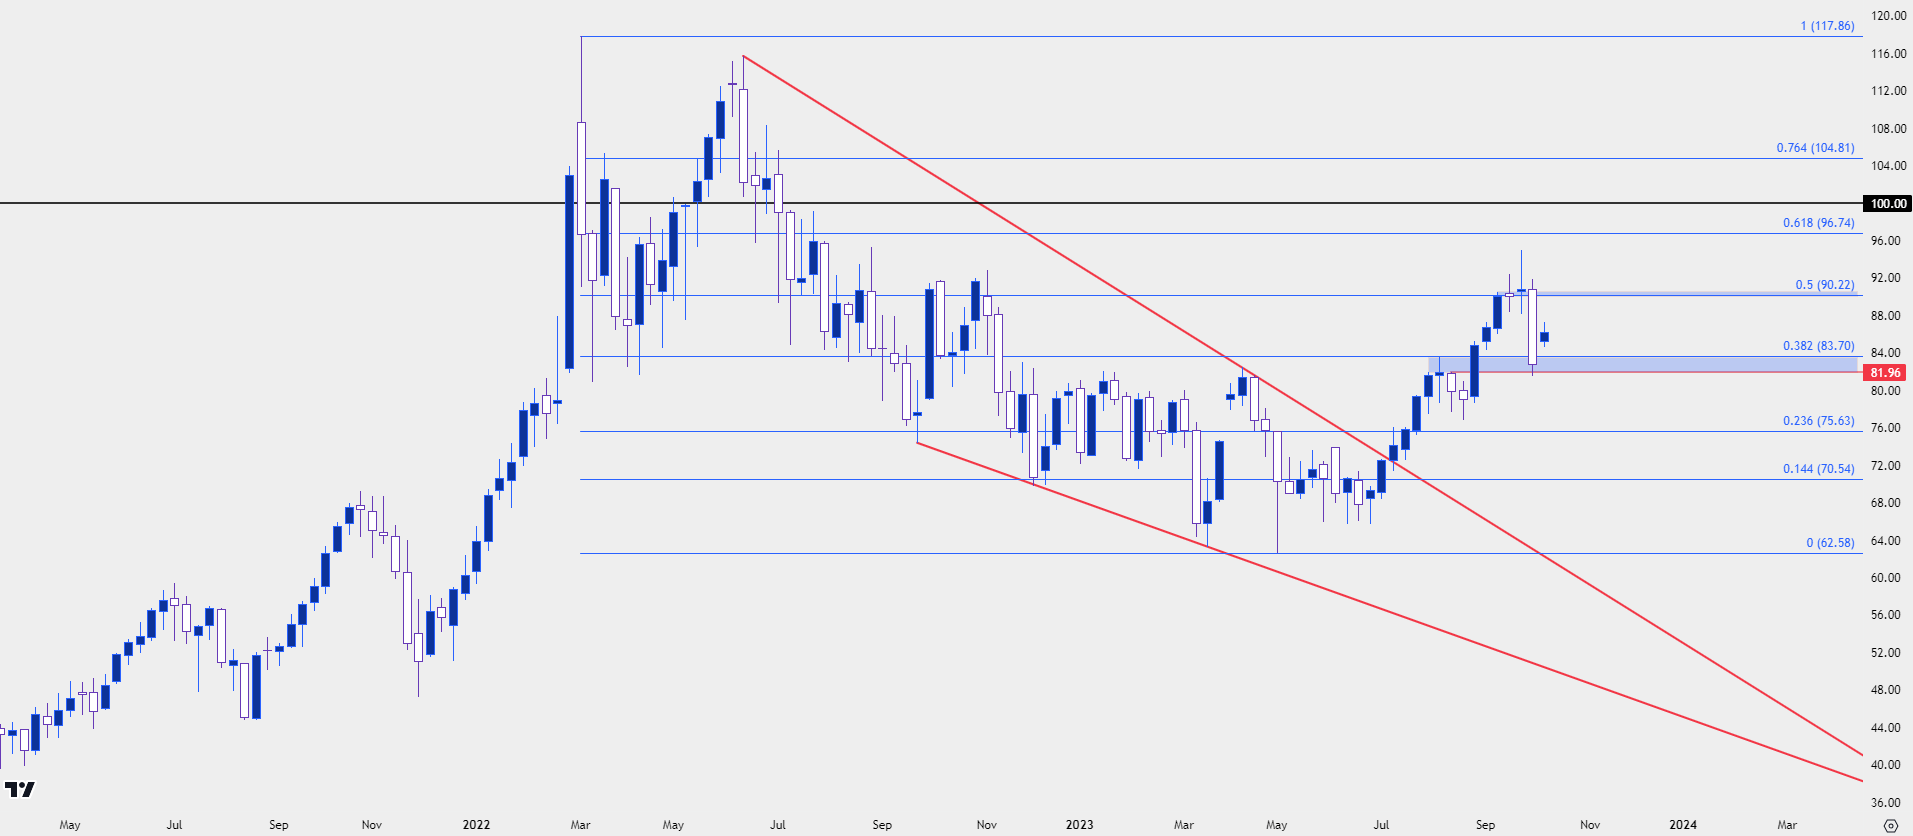 Chart prepared by James Stanley; data derived from Tradingview
From the daily chart below, we can get a better view of this week’s gap, along with some shorter-term technical items. Last week’s low showed around prior resistance and if that remains defended, there could be scope for bullish trend continuation.
For this week’s trade, it’s the 85 level that’s remained defended by bulls so far, and this keeps the door open for test of resistance from prior support as taken from 88.62. Above that level, there’s a Fibonacci level at 90.22, followed by price swings at 92.43 and then the 95.00 psychological level.
WTI Crude Oil Four-Hour Chart (indicative only)
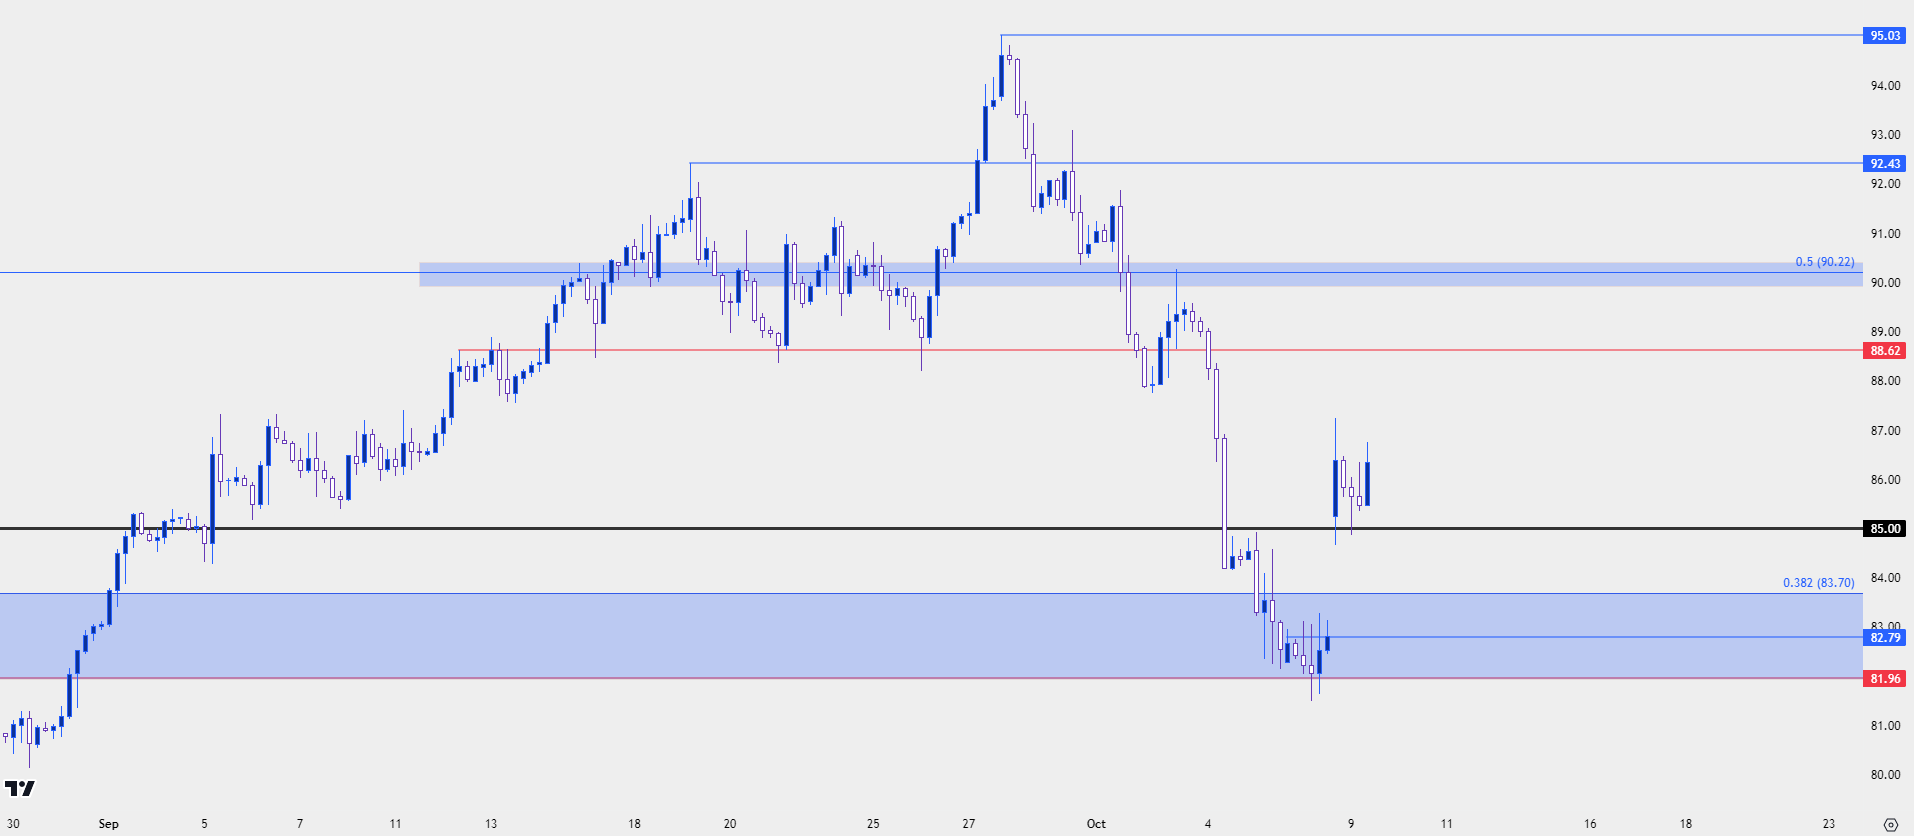 Chart prepared by James Stanley; data derived from Tradingview
--- written by James Stanley, Senior Strategist
Latest market news
Yesterday 01:32 PM
Yesterday 09:35 AM
Yesterday 07:23 AM
Yesterday 04:48 AM
Yesterday 12:17 AM
July 25, 2024 10:39 PM
Latest Trade Ideas articles

Yesterday 09:35 AM

Yesterday 12:17 AM

July 25, 2024 10:39 PM

July 25, 2024 05:30 PM