


July 21, 2022 12:28 AM

Canadian inflation rose 8.1% YoY in June vs an expectation of 8.4% YoY and a previous reading of 7.7% YoY. This was the highest reading since January 1983! Although the number was higher than May’s print, it missed expectations by a decent amount. In addition, the Core CPI print for June was 6.2% YoY vs 6.1% YoY expected and 6.1% YoY in May. Could this be peak inflation for Canada? The Bank of Canada hiked interest rates by 100bps last week as central bank governor Tiff Macklem said that front-loaded tightening cycles tend to be followed by softer landings. Although the 100bps rate hike did not affect June’s CPI reading, it may affect the July reading. The BOC doesn’t meet again until September; therefore, the central bank will have June and July CPI readings to take into consideration.
USD/CAD had been trading in a large range between 1.2454 and 1.3077 since November 2021. On July 14th, the pair posted a false breakout as the pair pushed higher through the top of the range, only to reverse the next day and move back inside. False breakouts on one side of a channel often lead to a test of the opposite side of the channel, which would target 1.2454. However, USD/CAD has a lot of ground to cover before it can get there. Currently, price is holding above resistance at 1.2871, which is the 50% retracement from the lows of June 8th to the highs of July 14th. It is also near trendline support, which extends back to the highs of June 17th.
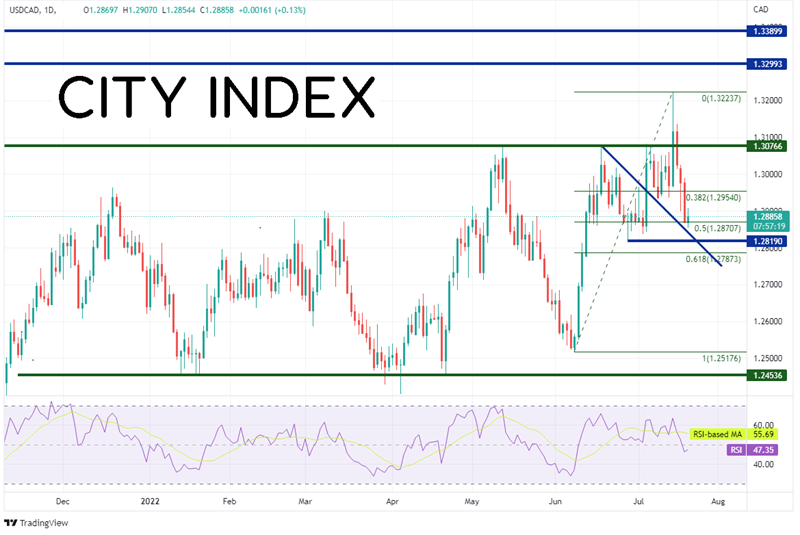
Source: Tradingview, Stone X
Trade USD/CAD now: Login or Open a new account!
• Open an account in the UK
• Open an account in Australia
• Open an account in Singapore
On a 240-minute timeframe of USD/CAD, there is a confluence of support near the previously mentioned downward sloping trendline and horizontal support between 1.2813 and 1.2830. Below there, price can fall to the 61.8% Fibonacci retracement level from the June 8th low to the July 14th highs at 1.2787, then horizontal support at 1.2627. However, if the support holds and USD/CAD moves higher, horizontal resistance sits at 1.2936. Above there, price can run all the way to the highs of July 14th at 1.3224, then the highs from the week of November 2nd, 2020 at 1.3271.
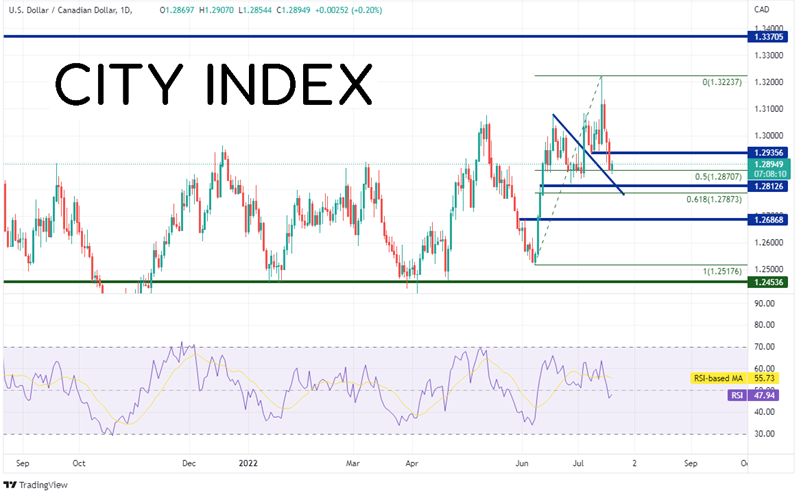
Source: Tradingview, Stone X
Although the June CPI reading for Canada was higher than the May reading, the headline was much lower than expected. Does this mean inflation has peaked in Canada? It may not matter for the moment as the BOC still gets to see July’s reading before it meets again in September. But if the July reading misses expectations as well, the BOC may not be hiking another 100bps to help lower inflation.
Learn more about forex trading opportunities.
Latest market news
Yesterday 01:32 PM
Yesterday 09:35 AM
Yesterday 07:23 AM
Yesterday 04:48 AM
Yesterday 12:17 AM
July 25, 2024 10:39 PM
Latest Trade Ideas articles

Yesterday 09:35 AM

Yesterday 12:17 AM

July 25, 2024 10:39 PM

July 25, 2024 05:30 PM