


April 26, 2022 5:09 AM

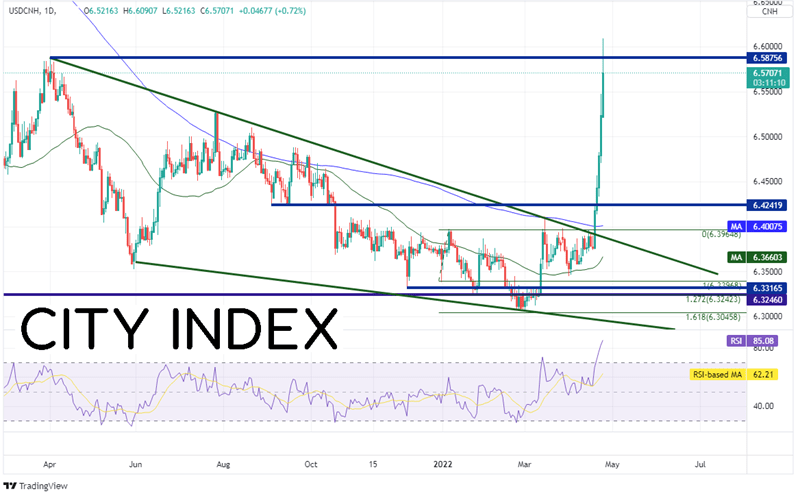
USD/CNH has been on the move as fears of additional lockdowns due to covid grip the markets. Lockdowns could lead to slower production and slower growth. Shanghai is currently entering its fourth week of lockdowns and fears are that Beijing could be next. As a result, the Yuan has sold off, causing USD/CNH to move higher.
On a daily timeframe, USD/CNH broke out of its descending wedge on April 19th and hasn’t looked back. The target for the breakout of a descending wedge is a 100% retracement of the wedge. The wedge began on April 1, 2021 at 6.5876 and began moving lower. Once price broke above the top trendline of the wedge at 6.3910, it only took 5 days to retracement the whole descending wedge!
Source: Tradingview, Stone X
Trade USD/CNH now: Login or Open a new account!
• Open an account in the UK
• Open an account in Australia
• Open an account in Singapore
If the markets worst fears do turn out to be true and China can’t avoid a longer-term slowdown, Australia and New Zealand are likely to take a hit as well, as they are both large exporters to China.
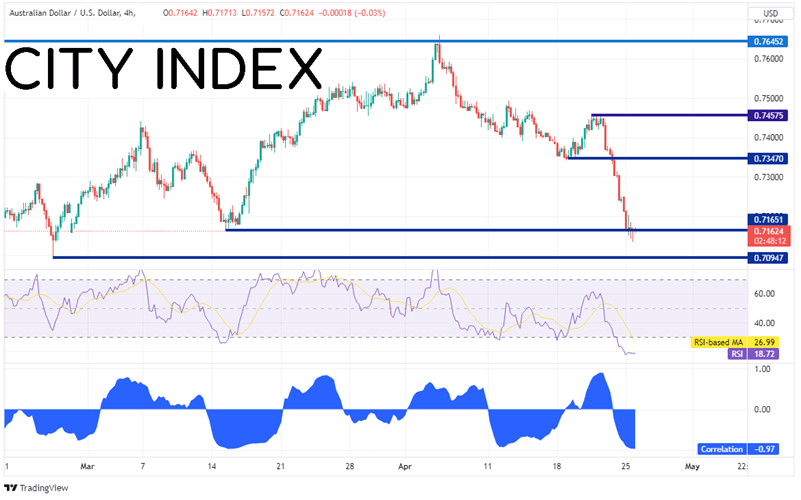
On a 240-minute timeframe, notice at the bottom of the chart that the correlation coefficient between AUD/USD and USD/CNH is -0.97. A reading of -1.00 means that there is a perfect negative correlation. In other words, when one currency pair moves higher, the other moves lower. A reading of -0.97 is extremely close! Therefore, if USD/CNH is ready for a correction, then AUD/USD should move higher. Also notice that the RSI on in oversold territory, an indication that the pair may be ready for a bounce. First resistance isn’t until 0.7347 and then 0.7458. The next support level is at 0.7095.
Source: Tradingview, Stone X
Trade AUD/USD now: Login or Open a new account!
• Open an account in the UK
• Open an account in Australia
• Open an account in Singapore
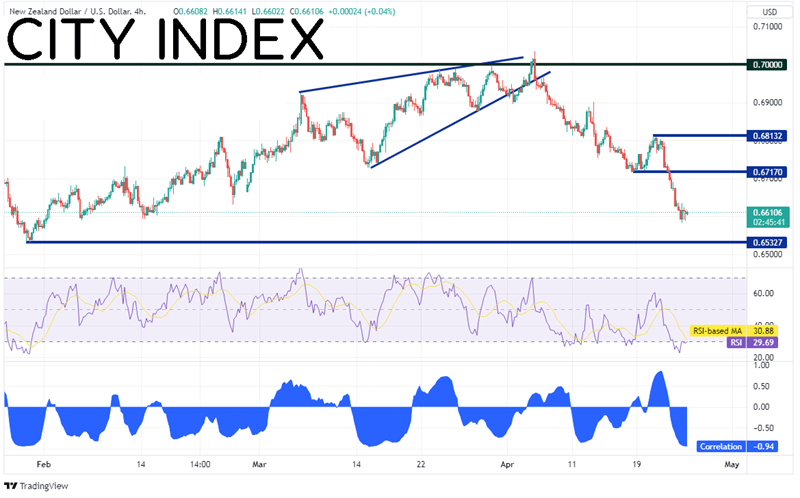
The correlation coefficient between NZD/USD and USD/CNH on a 240-minute timeframe is similar to the one of AUD/USD and USD/CNH at -0.94. Notice that the RSI here is also in oversold territory, indicating a possible bounce in price. First resistance in NZD/USD is at 0.6717 and then 0.6813. However, if price continues lower, the first support level for the pair isn’t until 0.6533.
Source: Tradingview, Stone X
Trade NZD/USD now: Login or Open a new account!
• Open an account in the UK
• Open an account in Australia
• Open an account in Singapore
USD/CNH has been moving higher for the last 5 trading sessions. As a result, AUD/USD and NZD/USD have been moving lower. Traders can use the correlation coefficient on the lower 240-minute timeframe between USD/CNH and the 2 pairs to help them determine where AUD/USD and NZD/USD may be headed next.
Learn more about forex trading opportunities.
Latest market news
Yesterday 01:32 PM
Yesterday 09:35 AM
Yesterday 07:23 AM
Yesterday 04:48 AM
Yesterday 12:17 AM
July 25, 2024 10:39 PM
Latest Forex articles

Yesterday 12:17 AM

July 25, 2024 10:39 PM

July 25, 2024 03:59 PM

July 25, 2024 04:37 AM