

Asian Indices:
- Australia's ASX 200 index rose by 6.7 points (0.1%) and currently trades at 7,056.10
- Japan's Nikkei 225 index has fallen by -173.31 points (-0.52%) and currently trades at 33,411.89
- Hong Kong's Hang Seng index has risen by 263.41 points (1.51%) and currently trades at 17,717.60
- China's A50 Index has risen by 65.9 points (0.55%) and currently trades at 12,000.20
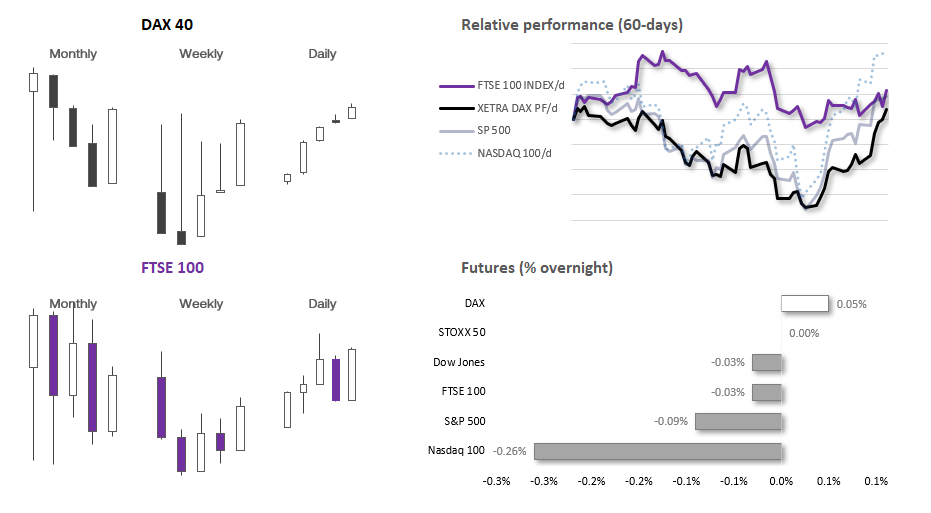
UK and European indices:
- UK's FTSE 100 futures are currently down -2 points (-0.03%), the cash market is currently estimated to open at 7,502.25
- Euro STOXX 50 futures are currently up 1 points (0.02%), the cash market is currently estimated to open at 4,341.77
- Germany's DAX futures are currently up 9 points (0.06%), the cash market is currently estimated to open at 15,928.16
US index futures:
- DJI futures are currently down -8 points (-0.02%)
- S&P 500 futures are currently down -4 points (-0.09%)
- Nasdaq 100 futures are currently down -40.5 points (-0.25%)
Events in focus (GMT):
- 16:00 – ECB Lane speaks
- 18:00 – German PPI
- 21:00 – EU construction output
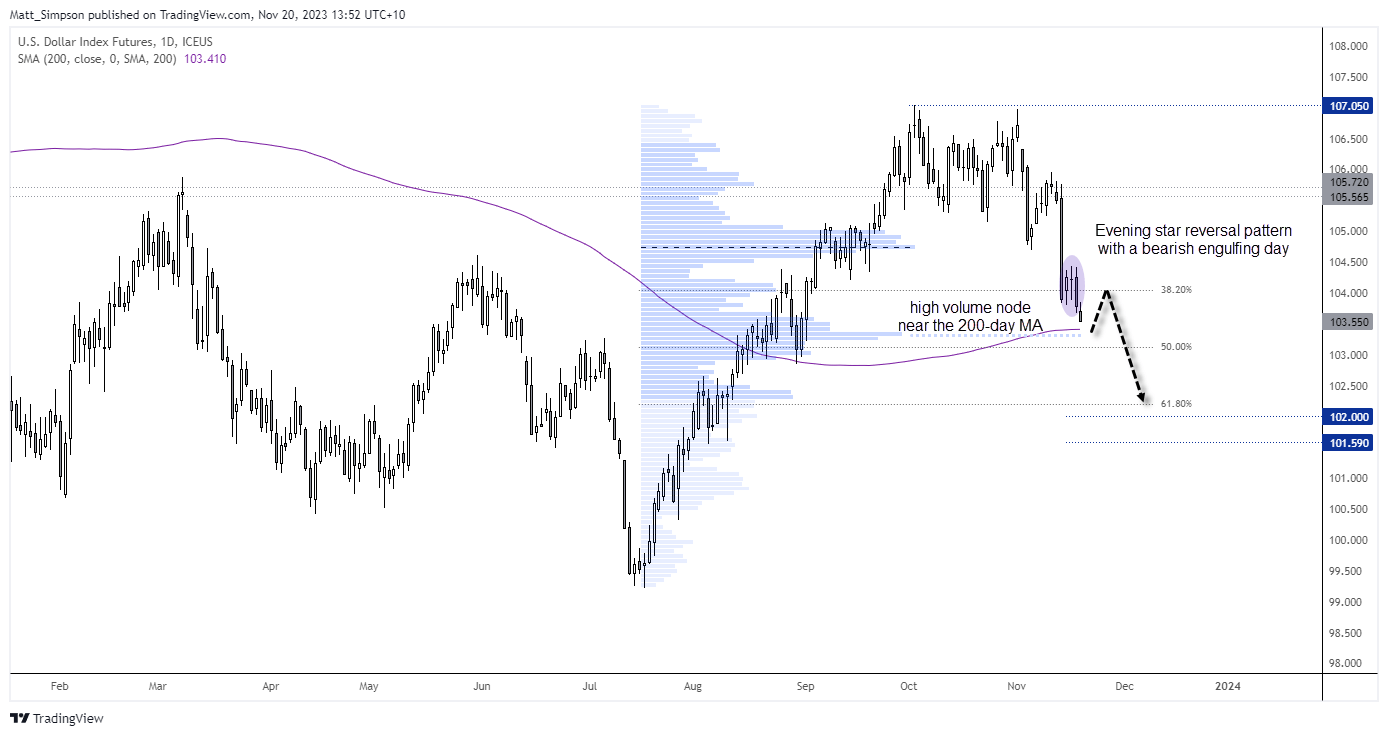
US dollar index technical analysis (daily chart):
After failing to hold above 1.07, the cracks began to appear on the US dollar and momentum has turned decisively lower. Most notably, the dollar index suffered its worst day of the year following Tuesday’s soft CPI report, and a bearish engulfing candle formed on Friday which has seen bearish follow through today in Asia.
However, there are two reasons that bears may want to be cautious around these lows. Not only do I suspect that the initial moves seen in Asia on a Monday tend to be false moves (when they mimic NY Friday), but the 200-day MA is also nearby to provide potential support. We could also add that there is a volume node around 103.35, and such areas can provide levels of support during a falling market.
You can see that there is a relationship between highs/lows and closing prices on the daily chart with the 200-day MA, so I’d expect some sort of a shakeout or minor rebound form 103.40. Regardless, the trend structure is clearly bearish on this timeframe so I favour fading into minor rallies below 104.50 for its next leg lower towards 103 ad then 102.
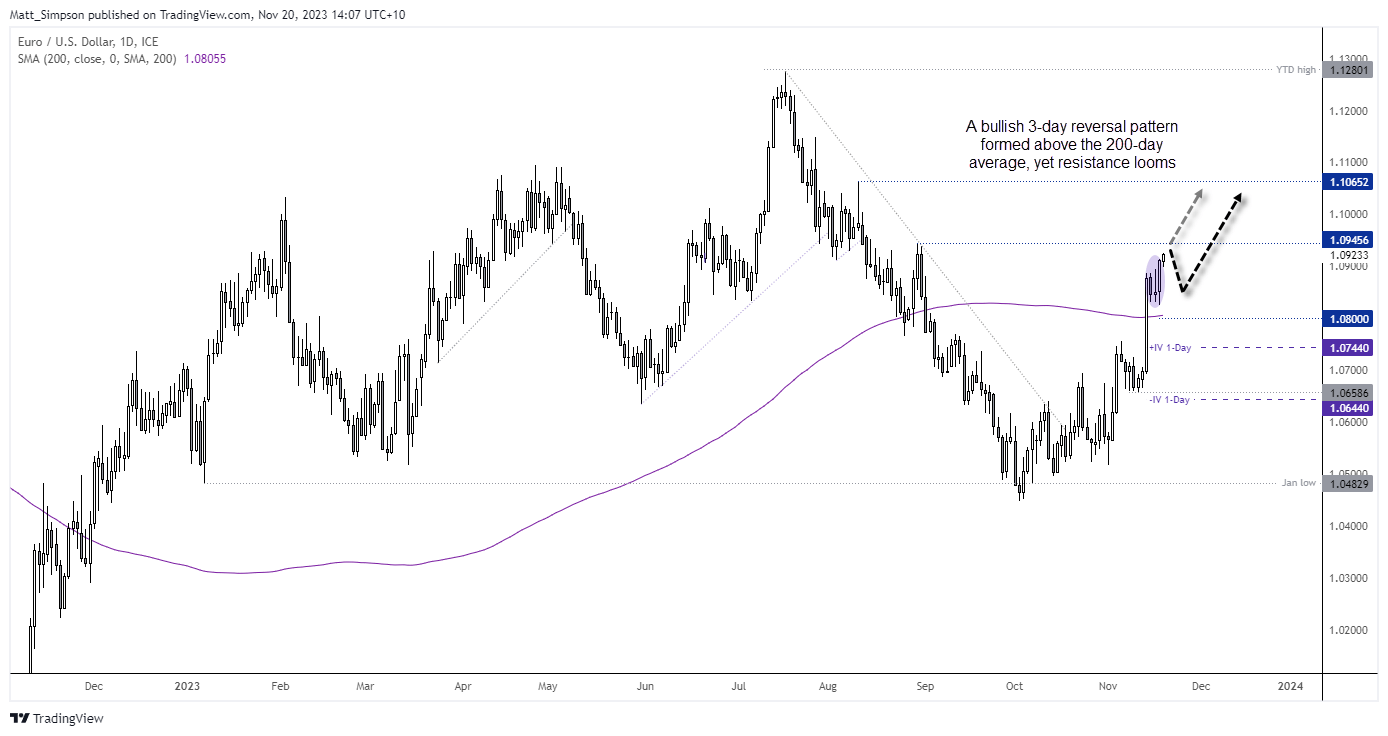
EUR/technical analysis (1-hour chart):
If we translate this to EUR/USD (as it accounts for ~57% of the US dollar index), it suggests a potential bump in the road for bulls over the near-term. Especially with the August 30 high within close proximity.
Still, EUR/USD broke above its 200-day EMA last Tuesday and held above it, and formed a 3-bar bullish reversal pattern. SO whilst I suspect we may see a failed break above 1.0945, I would consider bullish setups above 1.08 / the 200-day average.
View the full economic calendar
-- Written by Matt Simpson
Follow Matt on Twitter @cLeverEdge
How to trade with City Index
You can trade with City Index by following these four easy steps:
-
Open an account, or log in if you’re already a customer
• Open an account in the UK
• Open an account in Australia
• Open an account in Singapore
- Search for the market you want to trade in our award-winning platform
- Choose your position and size, and your stop and limit levels
- Place the trade
Latest market news
Yesterday 06:37 AM
April 26, 2024 01:25 PM
April 26, 2024 11:40 AM
Latest Trade Ideas articles


April 26, 2024 11:40 AM

April 25, 2024 03:00 PM

April 25, 2024 11:14 AM