

S&P 500, Nasdaq, Dow Jones Talking Points:
- Stocks are working on their first weekly gain of Q2, bringing with it the question of whether the prior bullish trend resumes, or whether bears step in to continue the sell-off that began around the Q2 open.
- The big item for next week is the Fed, and of late we’ve heard the FOMC paring back expectations for rate cuts this year. Another above-expected inflation print showed with Core PCE on Friday, further bringing to question the Fed’s ability to cut rates near-term.
- I’ll be discussing these themes in-depth in the weekly webinar. It’s free for all to register: Click here to register.
- In the Q2 Forecast for Equities I was looking for a pullback, and that’s shown so far through Q2 trade. To get the full forecast, the link below will allow for access:
It was a comeback type of week for stocks, even with Treasury Yields continuing to incline alongside another higher-than-expected inflation report on Friday.
While the Federal Reserve was in blackout this week ahead of the May 1st rate decision, the Treasury department was free to opine, and Janet Yellen offered some comments on Thursday morning that seemed to have a large push on equity price action. It helped stocks to hold a higher-low that soon led drove into a higher-high. Overall, she sounded somewhat dovish while also optimistic, balancing a line that helped bulls to further claw back a portion of the prior Q2 sell-off.
As of this writing, S&P 500 futures are fast approaching the 50% mark of that move, taken from the high on the first day of Q2 trade down to the low from last Friday.
S&P 500 Futures Daily Chart
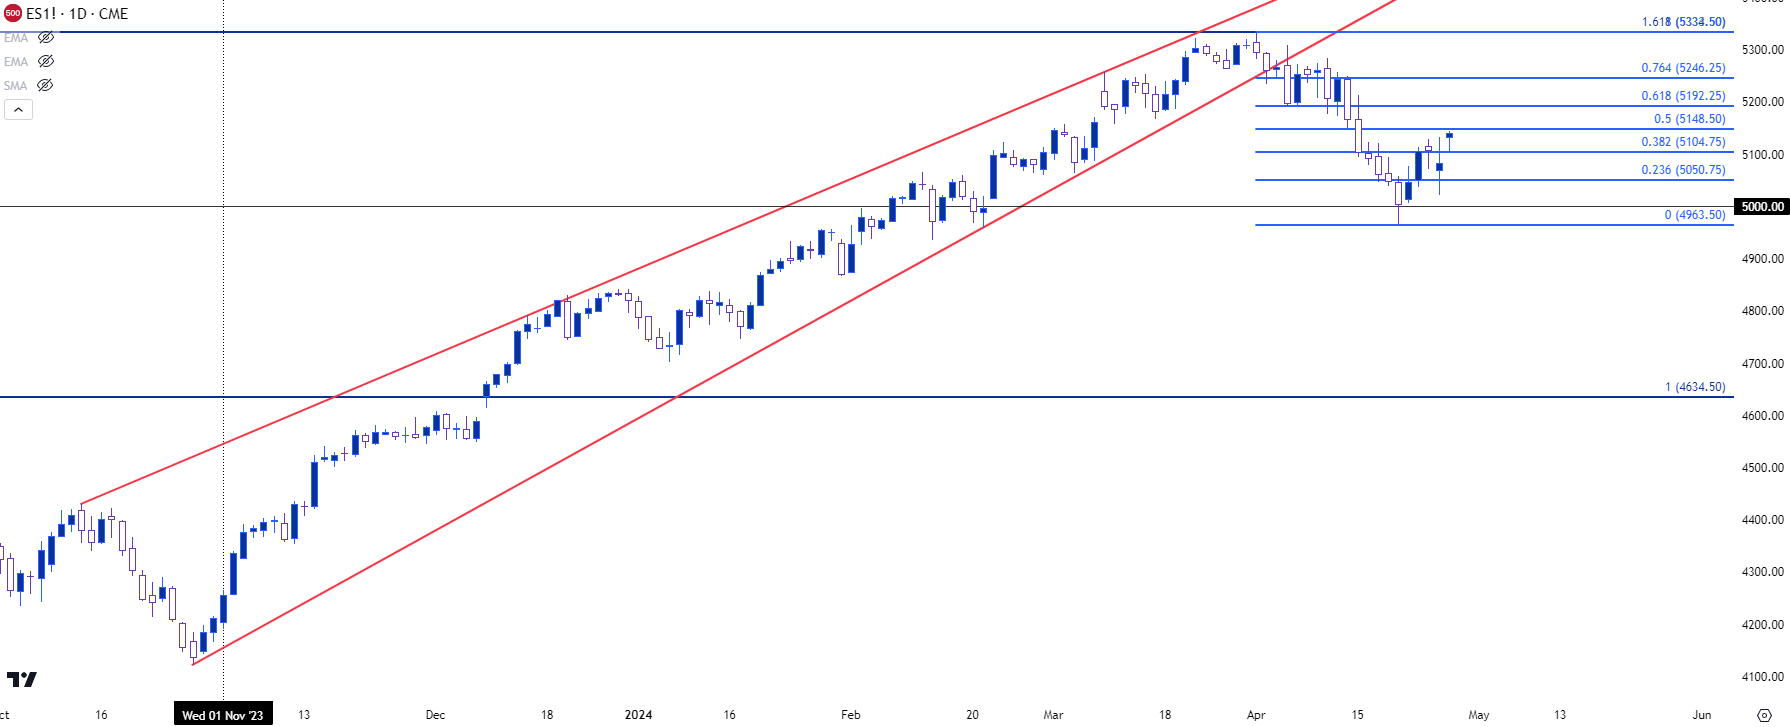 Chart prepared by James Stanley; data derived from Tradingview
S&P Longer-Term
In the Q2 Forecast one of the items that was focused on was RSI on the weekly chart, which had pushed up to just under the 80-level which is somewhat rare. There are only a couple of other similar occurrences drawing back to 1998.
But, also of interest is the 5334 level, which is the 61.8% extension of the 2022-2023 bullish move. So far, that level has helped to stall the advance around the Q2 open which has since led to pullback.
S&P 500 Futures Weekly Chart
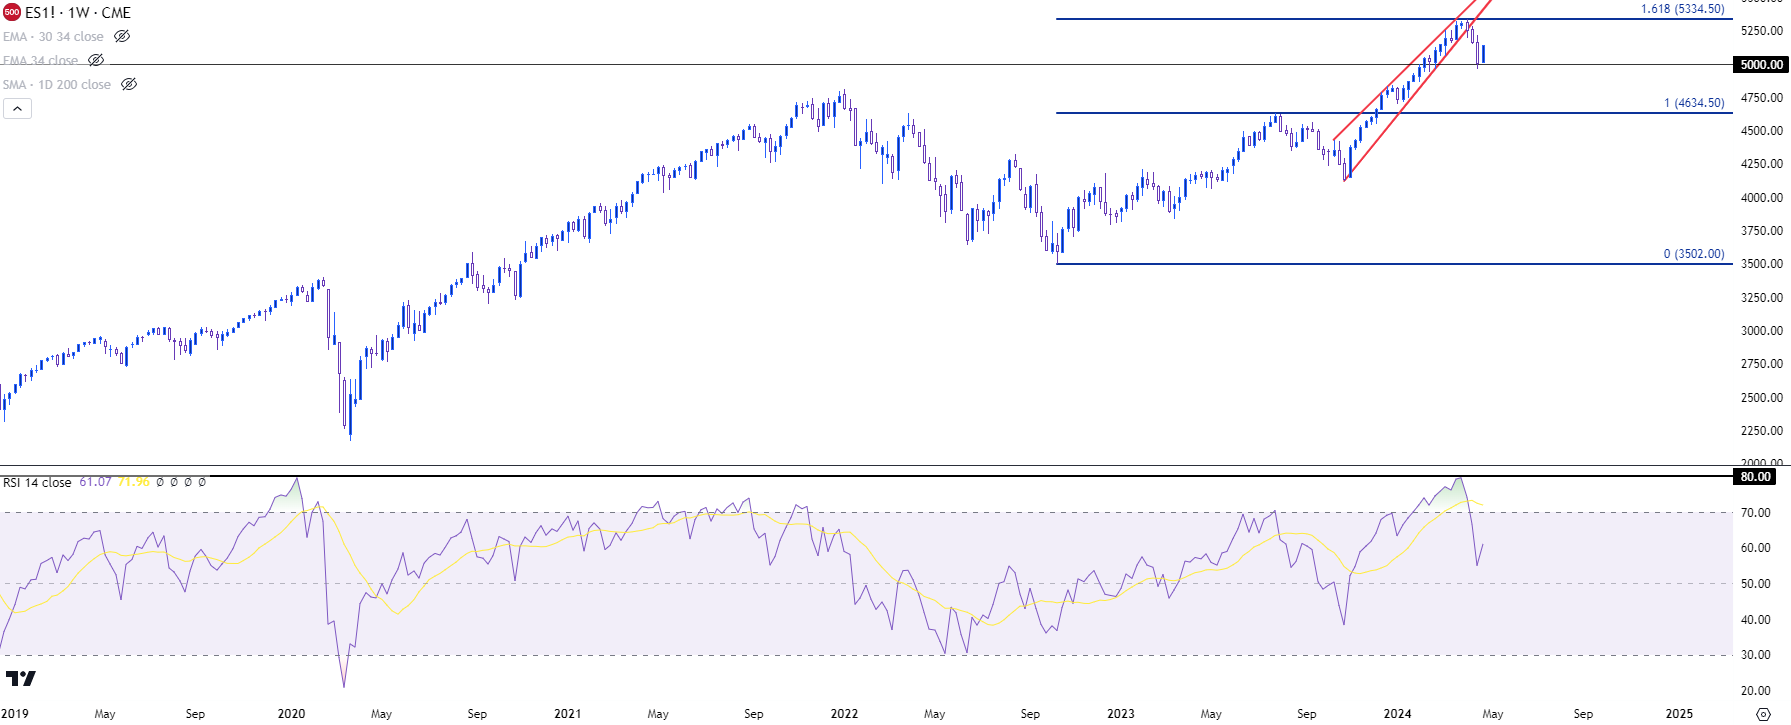 Chart prepared by James Stanley; data derived from Tradingview
S&P 500 Shorter-Term
The sell-off hit quickly in stocks, and in the week before last, matters got aggressive as S&P 500 Futures pushed below the 5k level. And around that time, RSI went into oversold territory, and almost deeply-oversold territory as the indicator neared a 20-print.
But the 5k level held the lows into the end of the week and despite stocks seeming to limp into the close, bulls made another showing last week in attempt of re-gaining control of price action.
But – this matter may not yet be over as the bearish trendline that developed in the opening days of Q2 sits overhead. For next Tuesday, that projects to around the 5200 level, which is confluent with the Fibonacci level at 5192.
From the daily chart, a hold there can even be argued as a possible lower-high, which would keep the door open for a 5k re-test.
The big matter, of course, is the Wednesday FOMC rate decision and for that bearish scenario to come to fruition, we would likely need to see some element of change from Chair Powell during the press conference, which has started to show to some degree. Powell’s comments before the Fed went into blackout seemed less-dovish than what we had heard at the Fed meeting in March.
Confounding matters is the fact that there are no new projections or forecasts to be released at the May rate decision; for that we have to wait until June. But, this gives Powell opportunity to manage the message during the press conference, and if he echoes his more recent tone, that could give bears something to work with.
S&P 500 Futures Four-Hour Price Chart
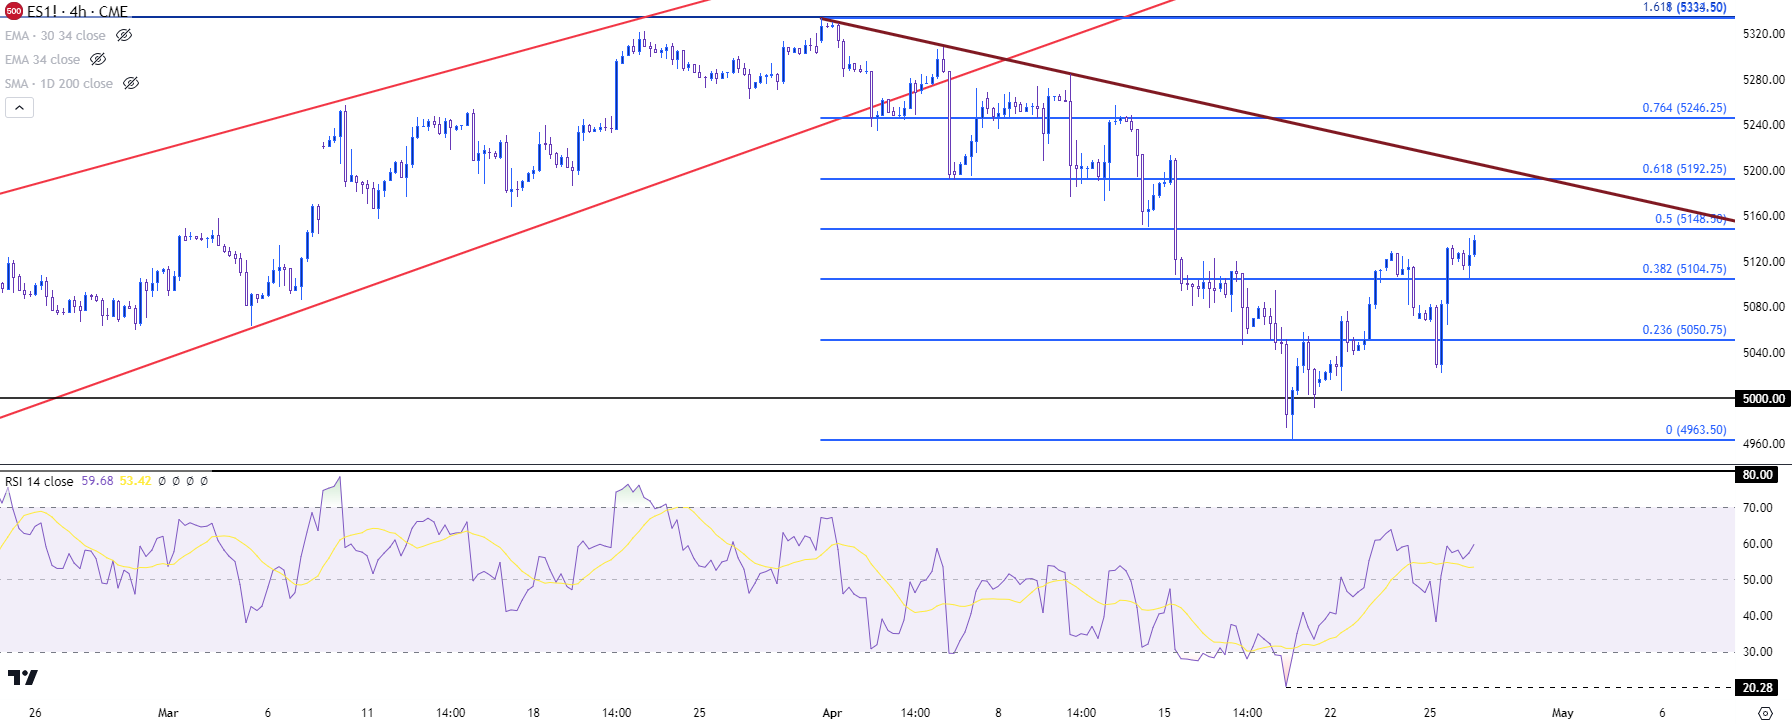 Chart prepared by James Stanley; data derived from Tradingview
Nasdaq
When stocks were spilling lower the week before last on Middle East tensions, Nasdaq 100 futures flashed their first oversold reading on the daily chart since September of 2022 – just before equities had bottomed.
This happened just after the index had completed the double top formation that I spoke of in the Q2 Forecast and like the S&P 500, this week was about bounce-back as shorts covered.
The big test here, however, is the 18k level, which was the neckline for the double top formation. I’ve spanned that up to 18,053 to mark a zone of resistance potential as taken from prior support.
Nasdaq 100 Futures Daily Chart
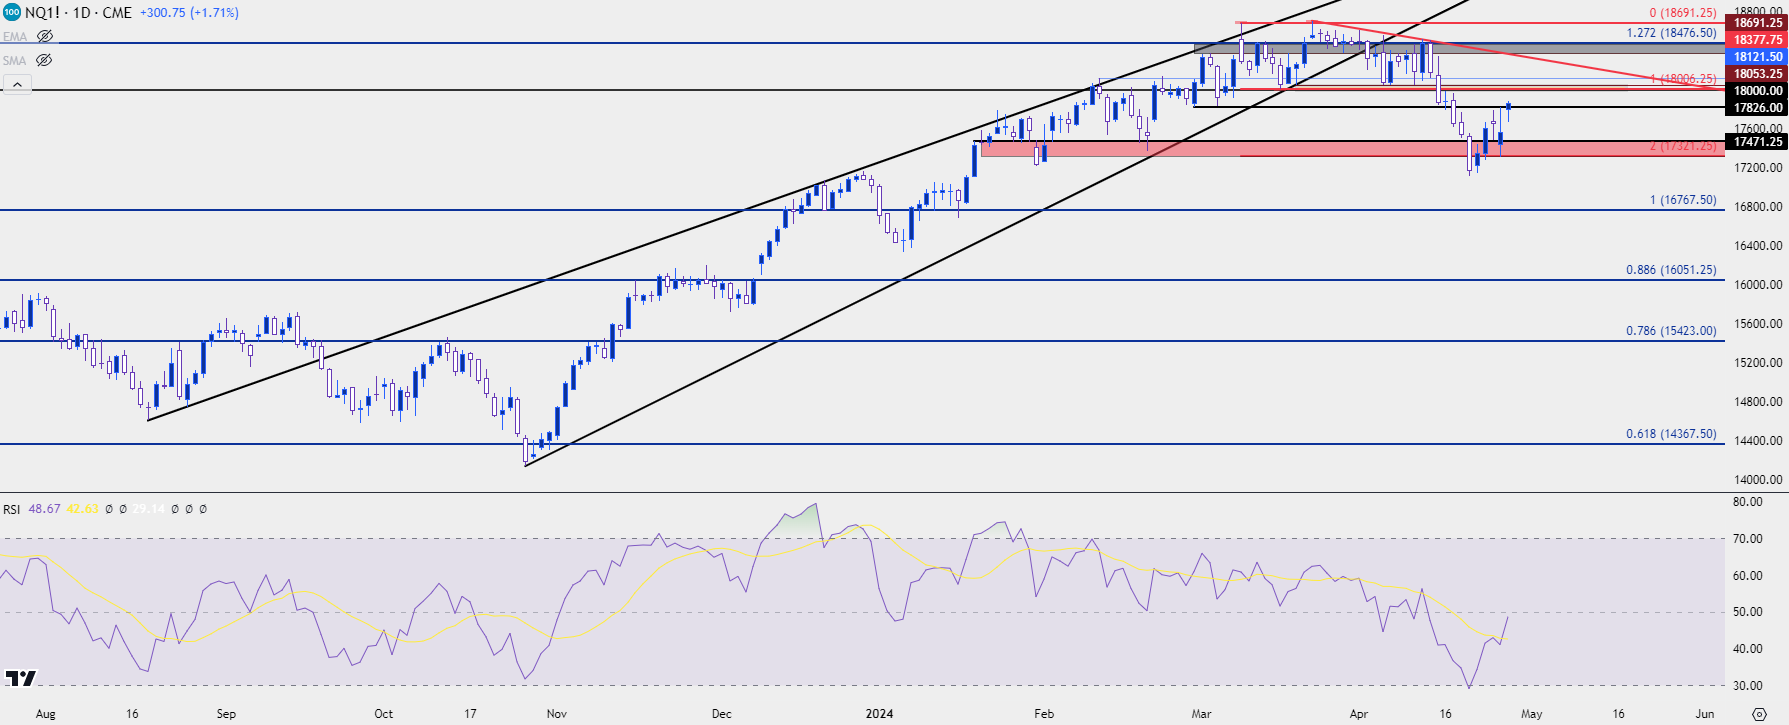 Chart prepared by James Stanley; data derived from Tradingview
Dow Jones
The Dow looked ‘less bad’ than the S&P or Nasdaq as we came into last week, largely on the basis of the fact that the prior weekly bar had printed as a doji rather than another red bar, such as we saw in the S&P and Nasdaq.
And this week was about cauterization of support at that level, taken from prior resistance around the 38,113 level.
In the Dow, it was the 40k psychological level that was the show-stopper as we came into Q2 and that remains an issue should bulls continue to drive into a re-test. There’s another spot that’s a little higher that remains of interest for lower-high resistance potential, and that’s the prior swing at 38,944, after which there’s a spot of resistance-turned-support at 39,657.
Dow Jones Futures Weekly Chart
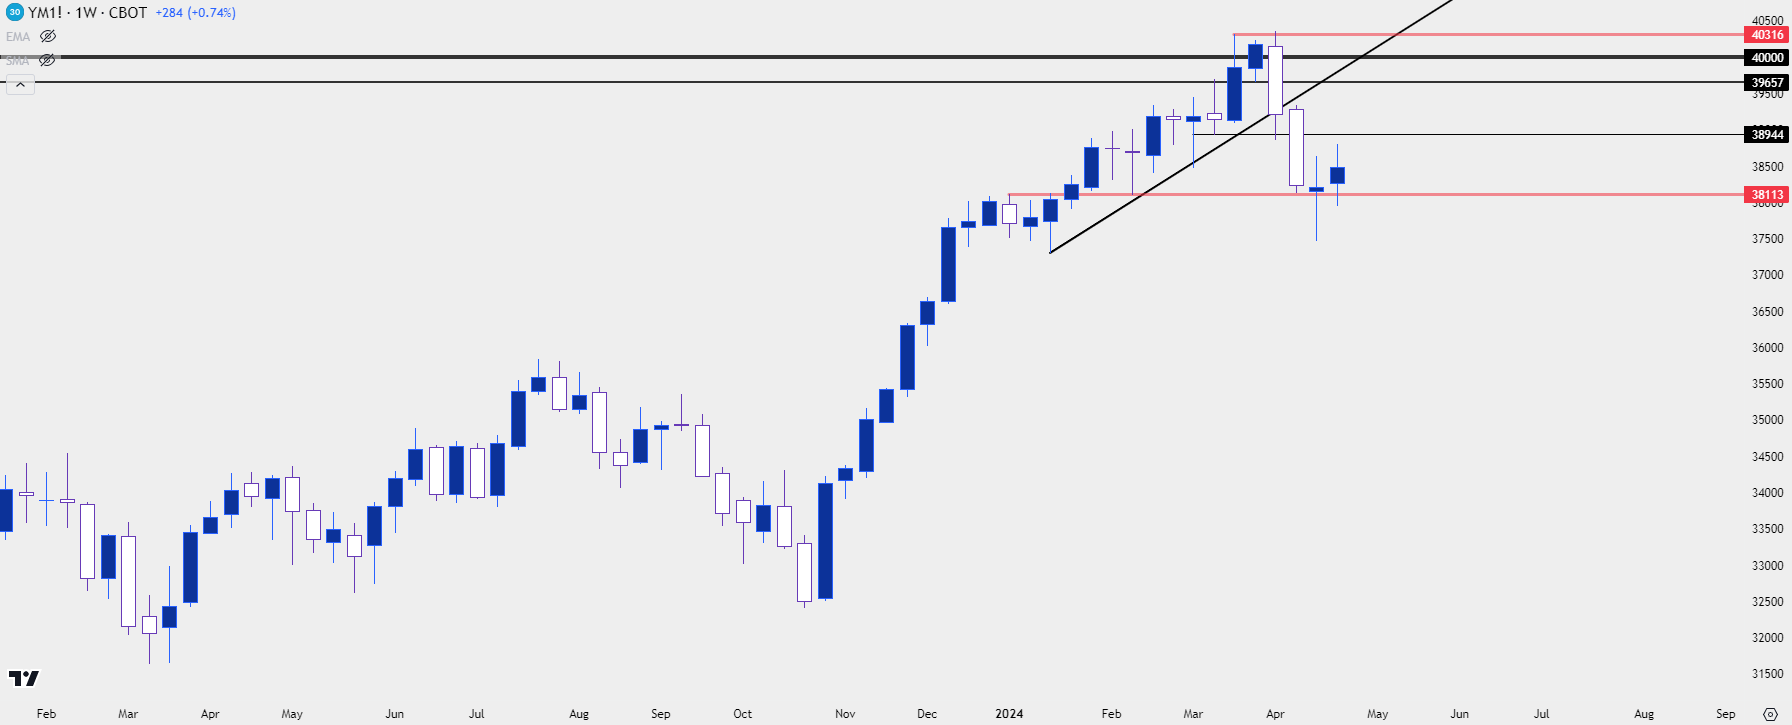 Chart prepared by James Stanley; data derived from Tradingview
--- written by James Stanley, Senior Strategist
Latest market news
Yesterday 01:32 PM
Yesterday 09:35 AM
Yesterday 07:23 AM
Yesterday 04:48 AM
Yesterday 12:17 AM
July 25, 2024 10:39 PM
Latest Trade Ideas articles

Yesterday 09:35 AM

Yesterday 12:17 AM

July 25, 2024 10:39 PM

July 25, 2024 05:30 PM