February 9, 2023 8:26 PM
Sweden’s Riksbank gathered earlier today for its Interest Rate Decision meeting in which it hiked rates by 50bps to bring the borrowing rate to 3.0%, its highest level since December 2008. In addition, the Riksbank noted there will be more rate hikes ahead and that it will begin Quantitative Tightening in April. The Riksbank doesn’t meet again until April 26th. Sweden’s January CPIF (the Riksbank’s preferred measure of inflation) rose to 10.2% YoY in December. The headline CPI print rose to 12.3% YoY, its highest level since February 1991. The central bank also noted that it would be helpful to have a stronger krona in order to guide inflation to the central bank’s target of 2%. This was a surprise to some market participants, as the Riksbank has been quiet on the currency as of late. It should be noted that this is the first central bank meeting led by Erik Thedeen after taking over as Riksbank Governor. Could we see more hawkishness ahead by the new central bank Governor?
In March 2020, USD/SEK traded to a pandemic high of 10.5016 before trading in a descending wedge formation to a post-pandemic low of 8.1252 in December 2020. USD/SEK then broke higher above the ascending wedge and began moving in an orderly channel. The pair retraced the entire move of the wedge (as is expected), and then some, reaching a high in late September 2022 at 11.4867. Notice that the pair traded above the channel as price reached the high. Often when price fails to break out of one side of a channel, it moves to test the opposite side. In this case, USD/SEK pulled back into the channel and broke the bottom trendline near 10.5000 in early November 2022. Since then, the pair has been trading in a range between horizontal resistance and the 38.2% Fibonacci retracement level from the January 2021 lows to the November 2022 highs. The range for these two levels is between 10.1510 and 10.7800.
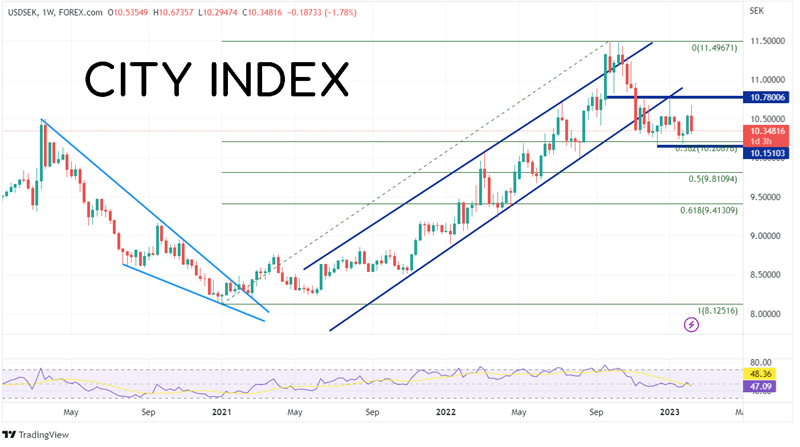
Source: Tradingview, Stone X
Trade USD/SEK now: Login or Open a new account!
• Open an account in the UK
• Open an account in Australia
• Open an account in Singapore
On a daily timeframe, one can better see the trading range that USD/SEK has been in since November 2022. Notice that the 50-Day and 200-Day Moving Averages are trading close together, a sign of indecision. In order for the pair to make its next meaning move, the pair is going to have to trade out of the range. After today’s hawkish Riksbank meeting, the pair fell nearly 2.50%. If the pair breaks 10.1510, the next support is the low from August 11th 2022 at 9.9998, then the 50% retracement from the above-mentioned timeframe at 9.8109. However, if USD/SEK moves higher (due perhaps to a strong US CPI print on Tuesday), the top of the range trendline is at 10.7492. Above there, the pair can move to the bottom trendline of the previous long-term channel near 10.9885, then the highs of November 3rd, 2022 at 11.2415.
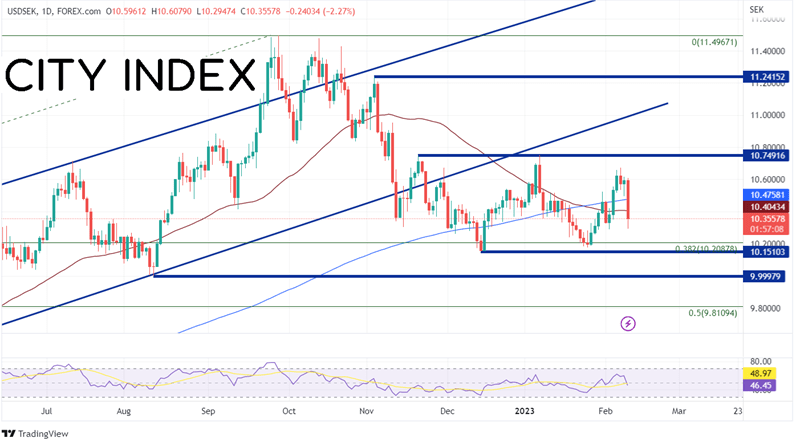
Source: Tradingview, Stone X
Sweden’s Riksbank hiked rates by 50bps today and said there is more to come. In addition, it announced that it would begin QT in April. As a result, USD/SEK fell nearly 2.50%, however it still remained withing its three-month range. Continued hawkishness from the Riksbank or a higher US CPI could send the pair out of the range. After that, there is room to run on either side!
Learn more about forex trading opportunities.
Latest market news
Yesterday 11:57 PM
Yesterday 08:00 PM
Yesterday 02:00 PM
Yesterday 08:00 AM
Latest Trade Ideas articles
Yesterday 11:57 PM

Yesterday 08:00 AM

April 26, 2024 11:40 AM

April 25, 2024 03:00 PM