
EUR/USD – Failure bullish breakout
click to enlarge charts
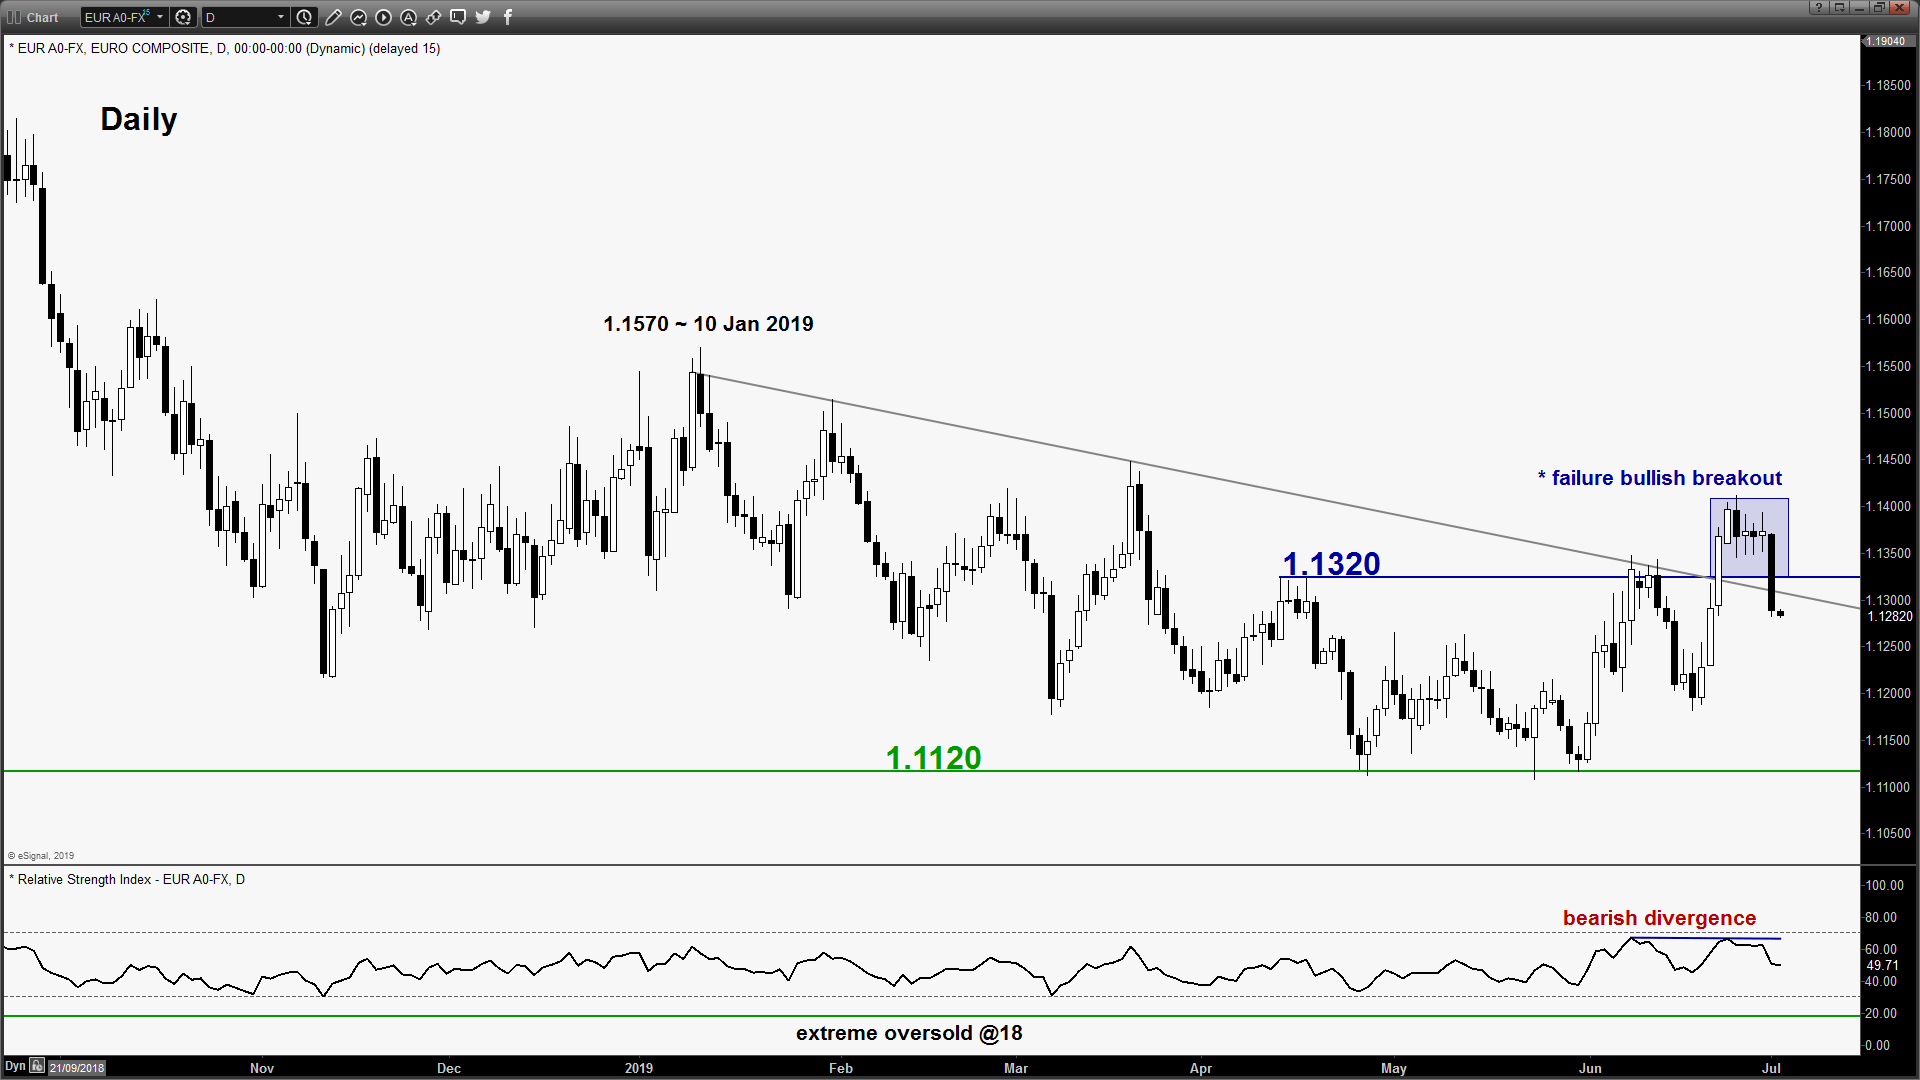
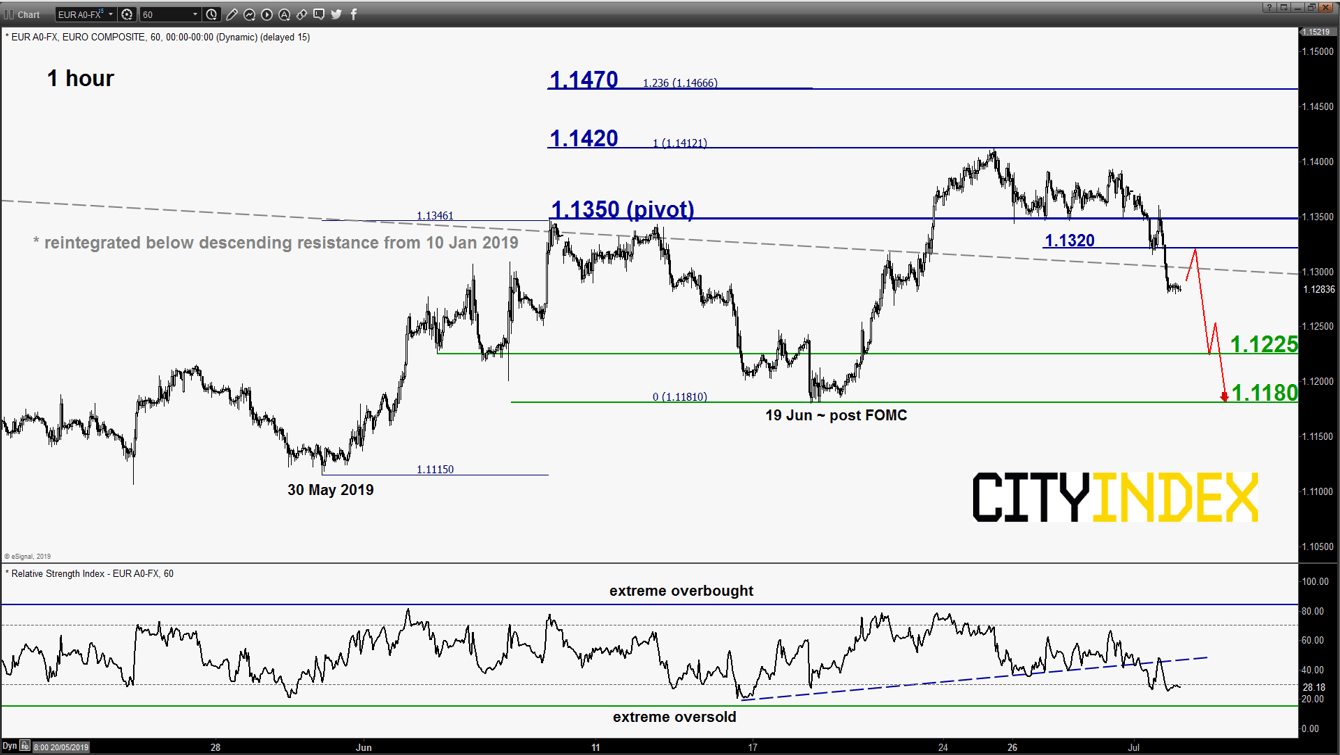
- Broke below the 1.1340 key short-term support as per highlighted in our previous report (click here for a recap). Latest price action has invalidated the push up scenario and also led to a failure bullish breakout from its descending trendline resistance that has capped previous rebound in price action since 10 Jan 2019.
- Flip to a bearish bias in any bounce below 1.1350 key short-term pivotal resistance (former minor range support from 26/28 Jun & 61.8% retracement of the recent slide from 28 Jun high to 01 Jul 2019 low) for a further potential push down towards the next near-term supports at 1.1225 and 1.1180.
- However, a clearance with an hourly close above 1.1350 negates the bearish tone for a squeeze up to retest 1.1420 (25 Jun 2019 swing high).
GBP/USD – Further push down in progress
click to enlarge chart
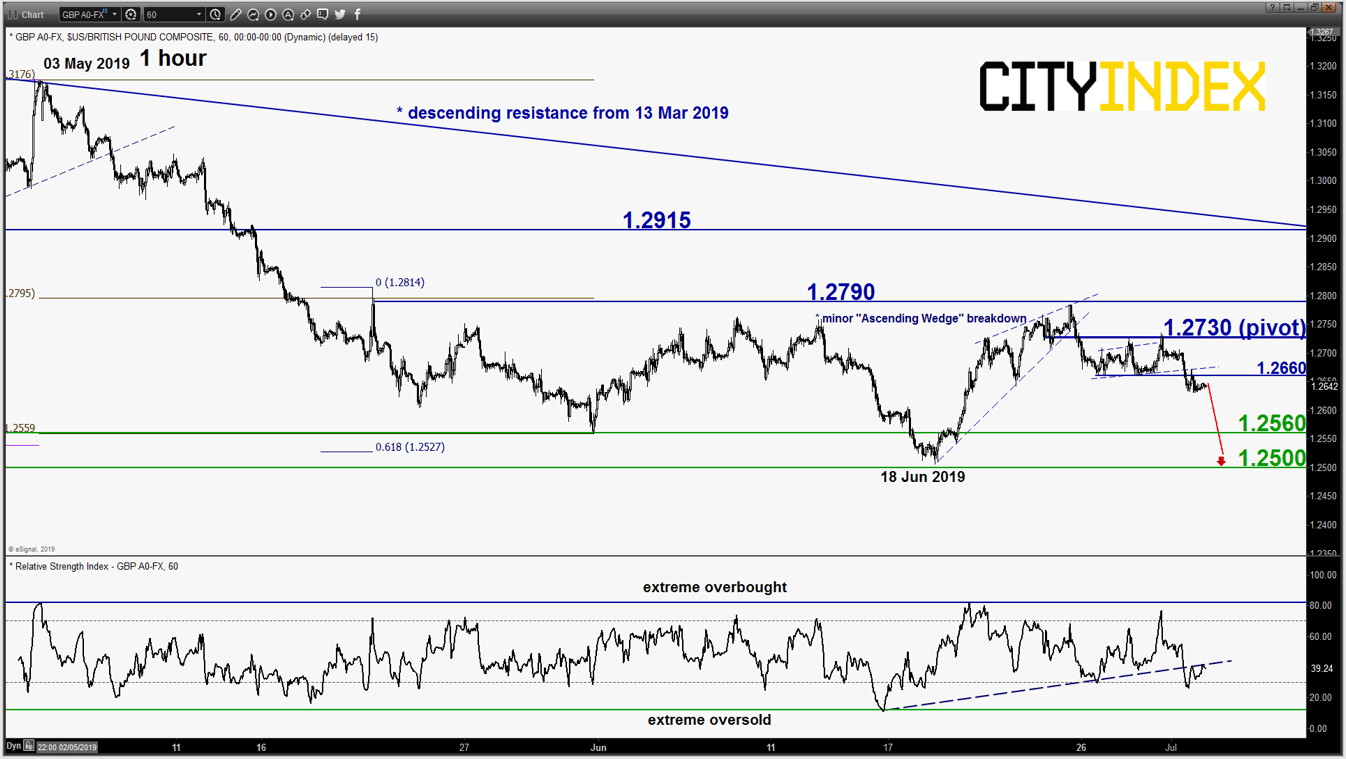
- Continued to inch down lower as expected. Key short-term elements remain unchanged, maintain bearish bias in any bounces below 1.2730 key short-term pivotal resistance for a further potential push down to retest the 1.2560/2500 major support (also the ascending trendline from Oct 2016 swing low).
- However, a clearance above 1.2730 negates the bearish tone for a retest on the recent range resistance of 1.2790. Only an hourly close above 1.2790 validates an extended corrective rebound scenario towards the next resistance at 1.2915 (also the descending trendline from 13 Mar 2019 high).
USD/JPY – At key resistance for potential bearish reversal
click to enlarge chart
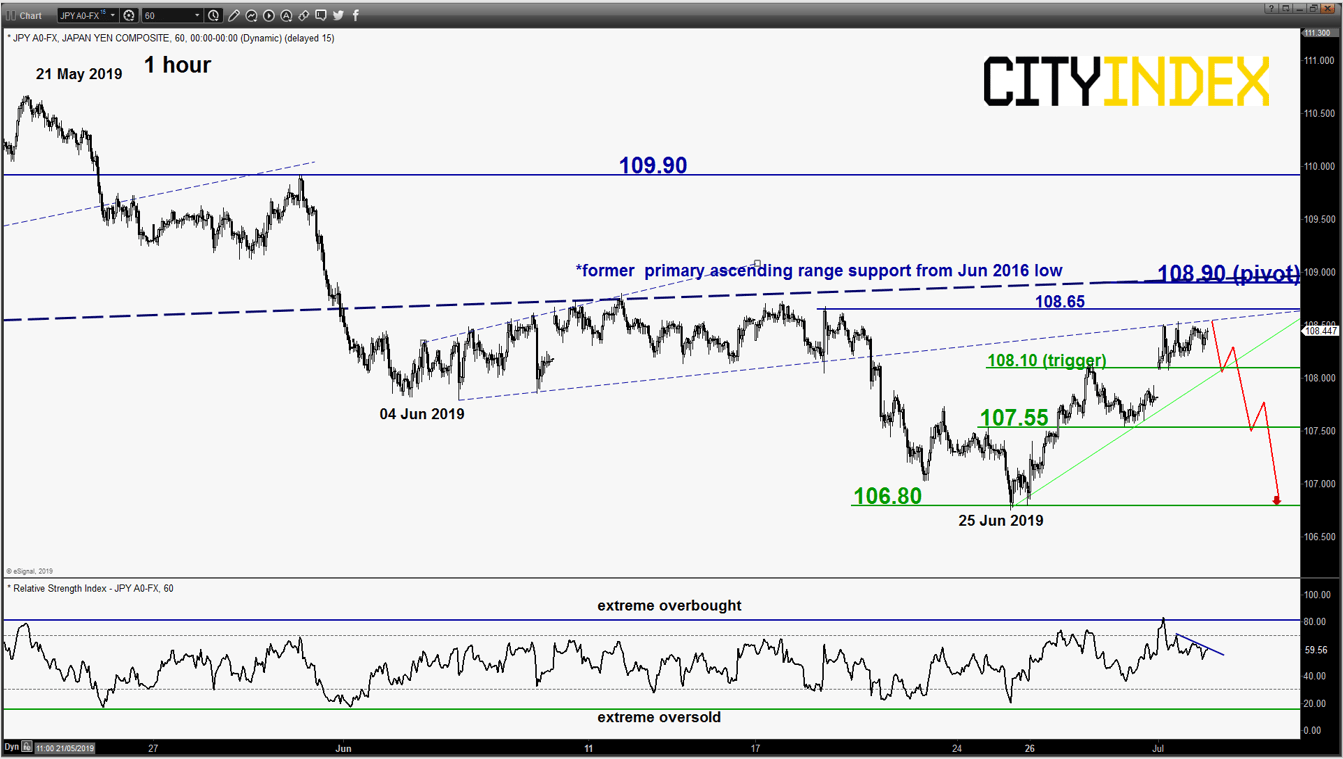
- Pushed up as expected and it had almost reached the upside target/resistance of 108.70 as per highlighted in our previous report (printed a high of 108.53 on 01 Jul 2019).
- The pair is now hovering right below the former primary ascending range support from Jun 2016 low now acting as a pull-back resistance at 108.90 which confluences with a Fibonacci retracement/expansion cluster.
- Short-term momentum has also turned negative as indicated by the 1-hour RSI oscillator. Flip to a bearish bias below 108.90 key pivotal resistance and a break below 108.10 reinforces the start of another potential impulsive downleg to target 107.55 and 106.80.
- However, a clearance with a daily close above 108.90 invalidates the bearish scenario for a squeeze up towards the next resistance at 109.90.
AUD/USD – Bearish elements sighted right at key resistance
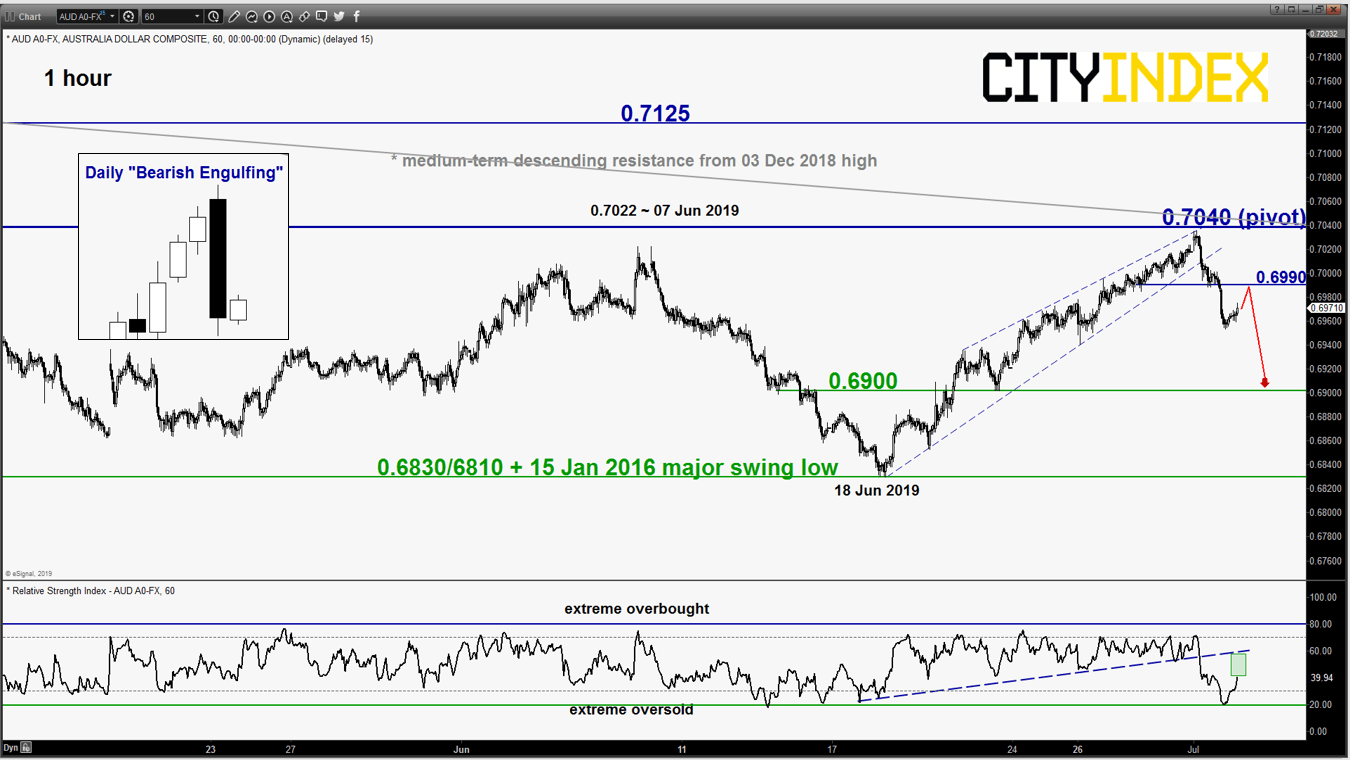
click to enlarge chart
- Staged the residual push up as expected and almost hit the upside target/resistance at 0.7050 as per highlighted in our previous report (printed a high of 0.7035 on 01 Jul 2019).
- The pair has ended yesterday, 01 Jul U.S. session with a daily “Bearish Engulfing” candlestick pattern right below the 0.7040 key medium-term resistance. Flip to a bearish bias in any bounces below 0.7040 pivotal resistance for a further potential push down to target the next near-term supports at 0.6900 and even 0.6830/6810 next.
- However, a clearance with a daily close above 0.7040 invalidates the bearish scenario for a squeeze up towards the next resistance at 0.7125 in the first step.
Charts are from eSignal
Latest market news
April 25, 2024 03:09 PM
April 25, 2024 03:00 PM
April 25, 2024 01:12 PM
April 25, 2024 11:14 AM
Latest USD articles


April 25, 2024 01:12 PM
April 24, 2024 01:23 PM

April 23, 2024 11:09 PM