

DJIA, S&P 500, Nasdaq 100 Key Points
- META’s stock price is falling -13% on weak Q2 revenue forecasts, dragging down indices like the S&P 500 and Nasdaq 100.
- Earnings season continues with Alphabet/Google and Microsoft after the bell today, as well as Amazon and Apple next week.
- The DJIA, S&P 500, and Nasdaq 100 all look vulnerable to more downside as long as this week’s highs hold.
META / Facebook Earnings Drag Indices Lower
After the close yesterday, Meta Platforms (META), the parent of Facebook and Instagram, reported its first quarter earnings, highlighted by profits of $4.71 per share and total revenue of $36.46 billion, which is a 27% increase from last year. The company also more than doubled its net income to $12.37 billion.
Despite these strong results, META’s stock price is falling -13% as we go to press, ostensibly because the revenue forecast for the next quarter was lower than what analysts expected, between $36.5 billion and $39 billion, which didn't meet the hoped-for $38.3 billion.
The drop in stock price is also being driven by Meta's plan to spend more on areas that don't yet make money, such as mixed reality and AI technologies, which CEO Mark Zuckerberg discussed during the earnings call. Additionally, Meta increased its expected spending on tech infrastructure, especially for AI, to between $35 billion and $40 billion for the year.
As one of the “Magnificent Seven” technology stocks that have driven much of the market’s gains over the past year+, the disappointing Q2 guidance from META has index traders worried that heavy investments in AI infrastructure may hurt profits for other “Big Tech” stocks. Looking ahead, traders will be monitoring the results from Alphabet/Google and Microsoft after the bell today, as well as Amazon and Apple next week.

Dow Jones Technical Analysis – DJIA Daily Chart
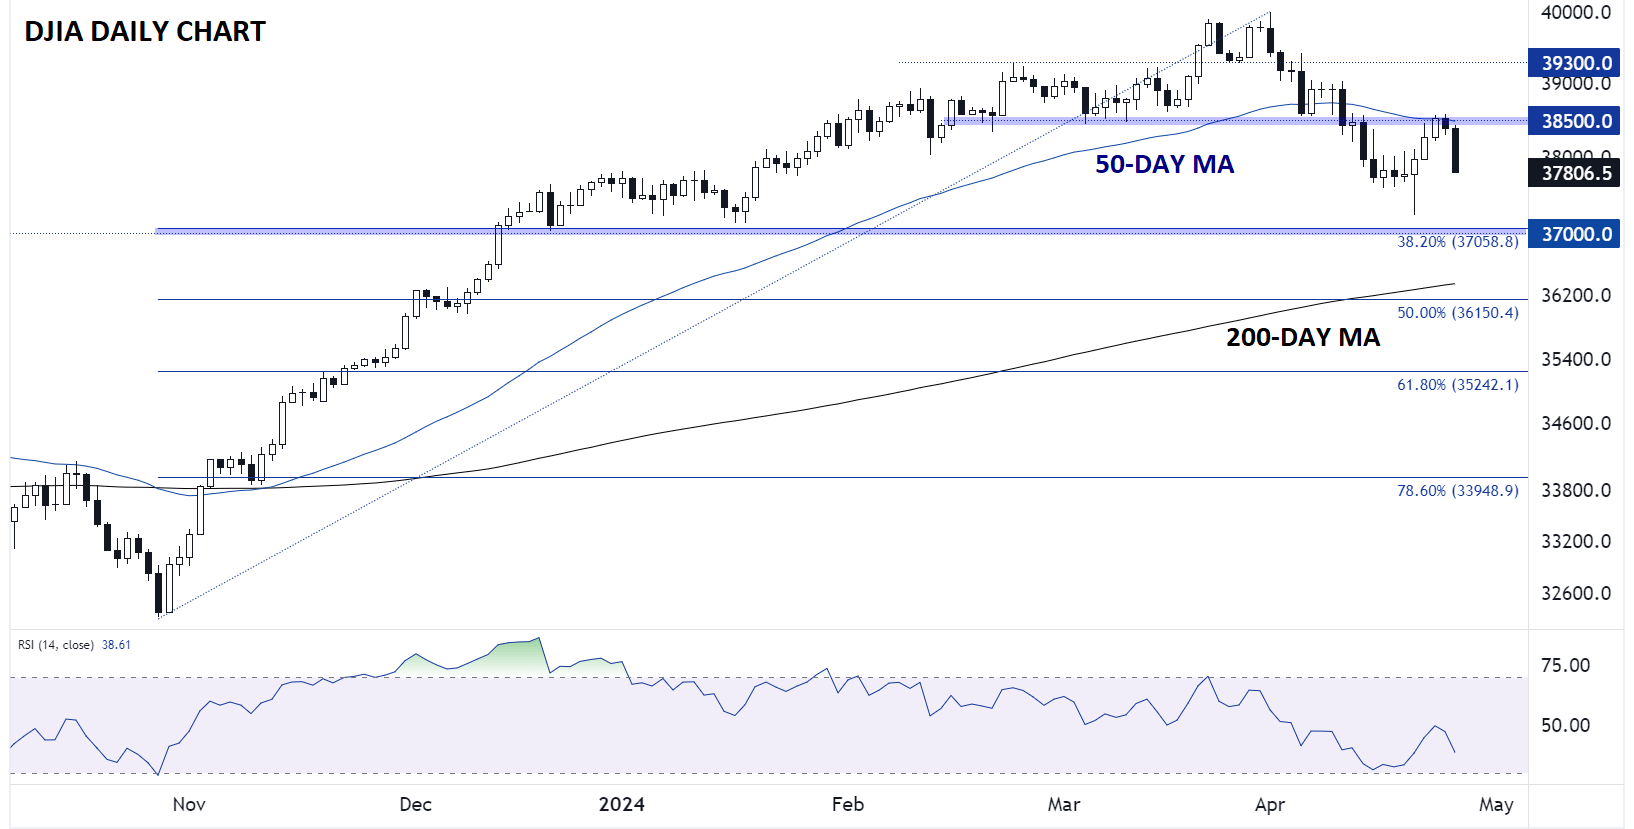
Source: TradingView, StoneX
Despite not holding META directly at all, the Dow Jones Industrial Average (DJIA) is seeing the worst performance of the day among the major US indices. From a technical perspective, the index has confirmed clear resistance at 38,500, where previous support from February and March meet the declining 50-day EMA. As long as the index remains below that level, bears will remain in control, with potential for a pullback to the 38.2% Fibonacci retracement of the November-April rally at 37,060.
S&P 500 Technical Analysis – SPX Daily Chart
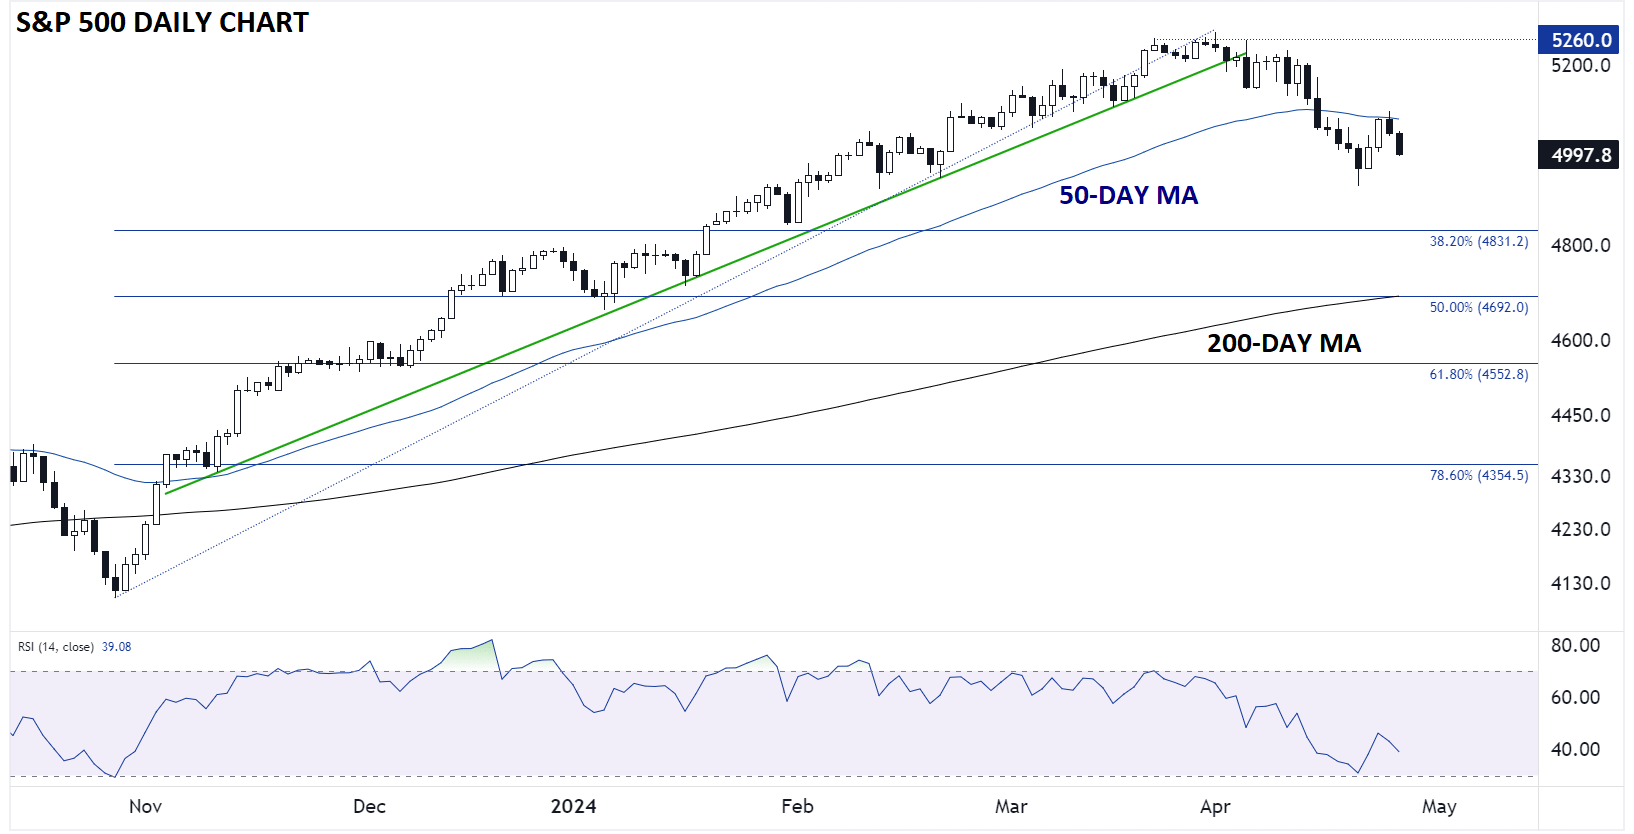
Source: TradingView, StoneX
The technical picture is similar for the S&P 500, with the index rising as high as 5,275 earlier this month before rolling over to test 5,000 as we go to press. Like the DJIA, the S&P 500 saw this week’s bounce stall at the 50-day EMA near 5,075, and with that level capping prices, a deeper retracement toward 4,830 may be in the cards next.
Nasdaq 100 Technical Analysis – NDX Daily Chart
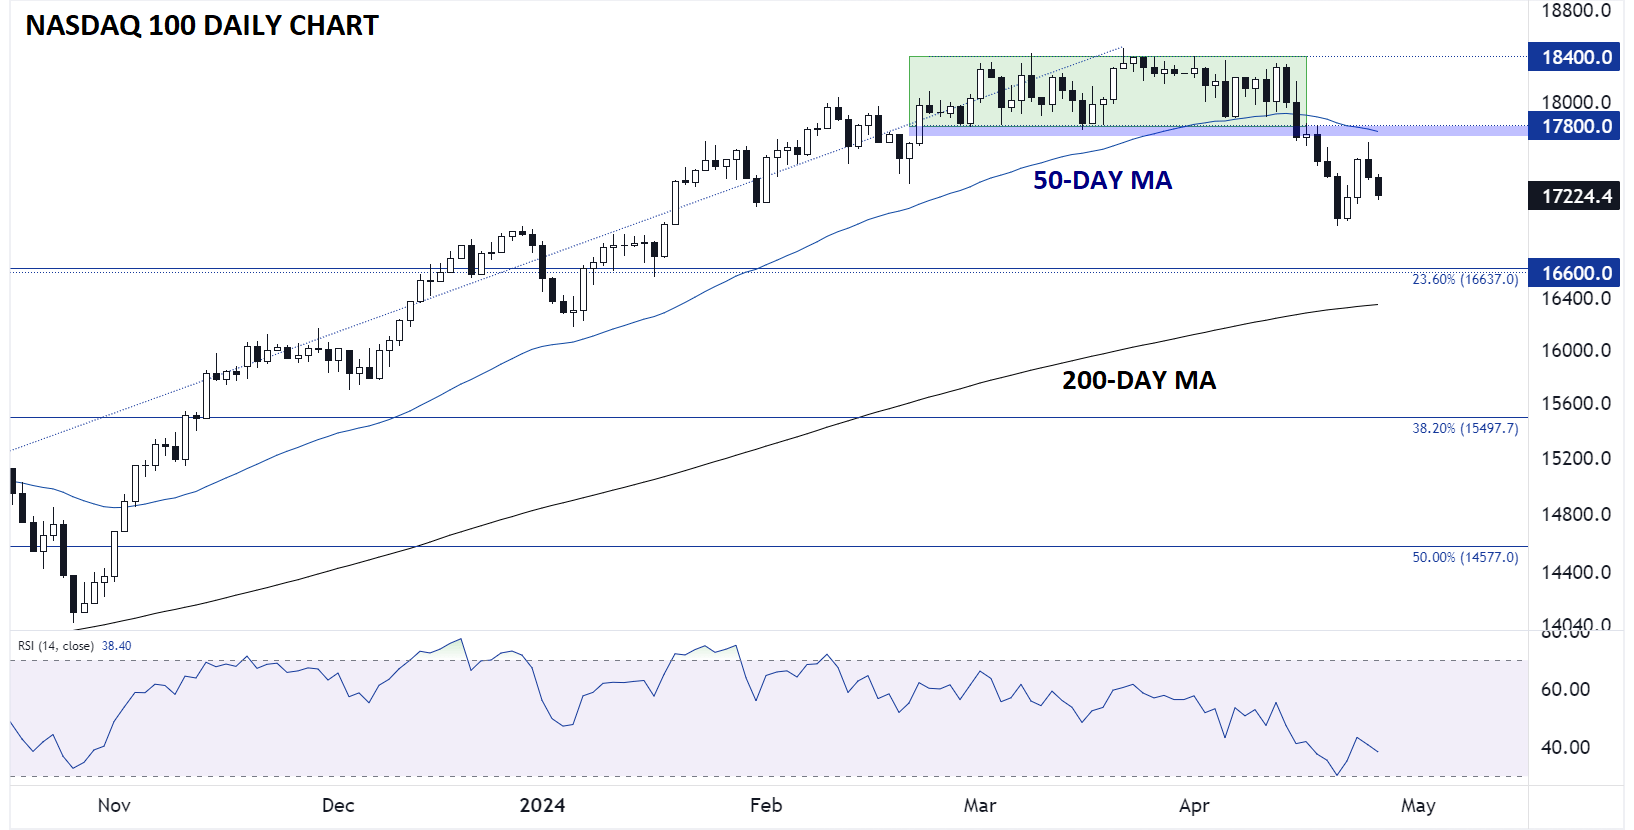
Source: TradingView, StoneX
Last (and maybe least), the Nasdaq 100 saw a comparatively weak bounce to start this week, failing to reach even the bottom of its March consolidation range at 17,800 before yesterday’s reversal. Looking ahead, the lackluster bounces hints at relatively weak buying support on dips and opens the door for a retracement back toward the 23.6% Fibonacci retracement of the whole 2023-2024 rally near 16,650 next.
-- Written by Matt Weller, Global Head of Research
Follow Matt on Twitter: @MWellerFX
Latest market news
Yesterday 01:32 PM
Yesterday 09:35 AM
Yesterday 07:23 AM
Yesterday 04:48 AM
Yesterday 12:17 AM
July 25, 2024 10:39 PM
Latest DJIA articles

July 24, 2024 07:26 PM

July 17, 2024 04:24 PM
July 11, 2024 04:30 PM
June 24, 2024 04:00 PM