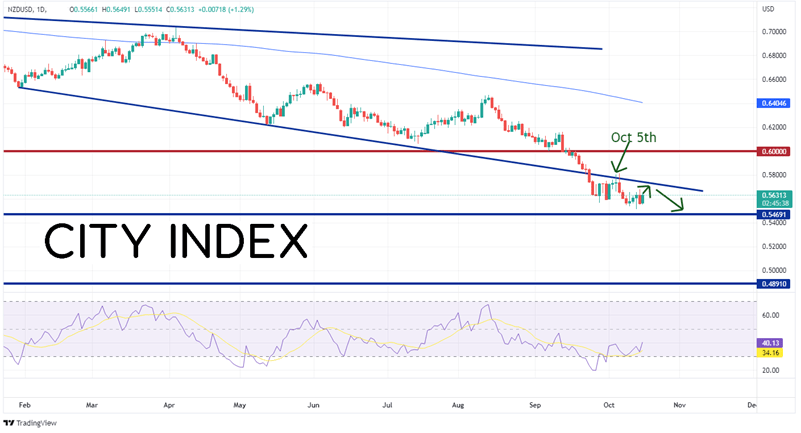
When the RBNZ last met on October 5th, some thought it may follow in the footsteps of its Antipodean relative, the RBA. Earlier that week, the RBA only hiked interest rates by 25bp, as a 50bps hike was expected. However, the RBNZ stuck to its own script and hiked rates by 50bps to 3.5%. Minutes showed that members were considering a 75bps hike! The main reason cited for the increase: Core CPI inflation was too high. Later today, New Zealand will release its Q3 CPI. Expectations are that the headline print will drop from 7.3% YoY in Q2 down to 6.6% YoY in Q3. If CPI comes out worse than expected, the Kiwi should move lower vs the US Dollar. However, what will happen if it comes out stronger? Based on the price action of NZD/USD on the day of the RBNZ meeting, the pair may see a pop, but it may then resume its path lower in the current trend.
On the day of the RBNZ meeting, in which it raised 50bps and was hawkish, the daily candlestick closed by forming a doji candlestick, in which NZD/USD rose higher into the announcement, sold off after it to new lows on the day, and closed near the opening level, up 8 pips on the day. After such a statement, one may have expected that the Kiwi would continue to move higher. However, it was not to be, as NZD/USD reached its lowest level since March 2020 at 0.5512 on October 13th. Could the pair continue to move lower?

Source: Tradingview, Stone X
Trade NZD/USD now: Login or Open a new account!
• Open an account in the UK
• Open an account in Australia
• Open an account in Singapore
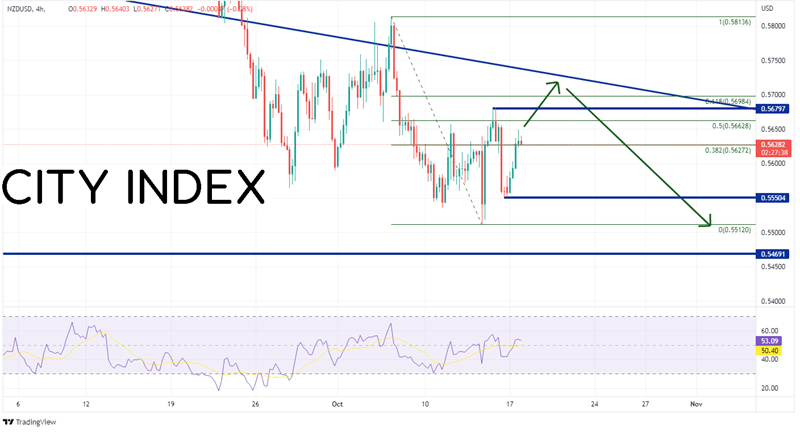
On a 240-minute timeframe, after NZD/USD made a new yearly low on October 13th, it started to move higher. However, the pair could barely make it to the 38.2% Fibonacci retracement level from the highs of October 6th to the lows of October 13th near 0.5627. If NZD/USD continues to move higher after the CPI print, it could run into resistance at the October 14th highs of 0.5680. Just above there is the 61.8% Fibonacci retracement level from the previously mentioned timeframe near 0.5698, then the downward sloping trendline (see the daily) near 0.5730. However, if price can not maintain its current bid, first support is at the October 14th lows of 0.5550, then the lows from October 13th at 0.5512. If price breaks below there, the next support level is the lows from March 2020 at 0.5469.

Source: Tradingview, Stone X
NZD/USD is sitting near its March 2020 lows. Will it move below it? If the price action is the same after the CPI print as it was after the hawkish RBNZ, then bounces will be sold into and the pair could take out the lows. If the CPI print it worse, the pair may just move lower regardless.
Learn more about forex trading opportunities.


