


November 15, 2022 4:03 PM

Last week, the US released October CPI at 7.7% YoY vs an expectation of 8.0% YoY. On Tuesday morning, the US followed with additional inflation data, October PPI. The expectation was for a YoY print of 8.3%. However, the actual print was lower at 8%, much lower than the 8.4% YoY print in September. In addition, the Core PPI YoY print for October was 6.7% vs an expectation of 7.2%. The previous September reading was 7.2%. Since the FOMC November meeting, Fed speakers have been on the wires discussing a possible slowdown in the pace of increases in the Fed Funds rate hikes. On Monday, Fed’s Brainard said that “it will probably be appropriate soon to move to a slower pace of increases.” But is the lower inflation data from the last 2 weeks enough to make the Fed lower the pace of interest rate increases from 75bps to “only” 50bps? According to the CME Fedwatch tool, the markets are pricing in an 85.4% chance of a 50bps rate hike at the December 14th meeting. Before the CPI data last week, markets had been looking for roughly a 50/50 chance of a 50bps rate hike and a 75bps rate hike.
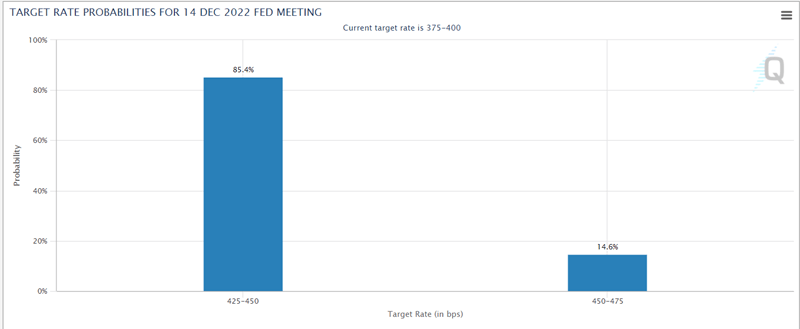
Source: CME
EUR/USD had been moving lower in an orderly channel since February when the pair reached a Year-to-Date high of 1.1495. On September 28th, the pair reached a low of 0.9536, testing the bottom trendline of the channel. The pair bounced and broke about the top trendline of the channel on October 25th, near 0.9975. EUR/USD moved through strong resistance near 1.0350/70and traded to an intra-day high of 1.0482.
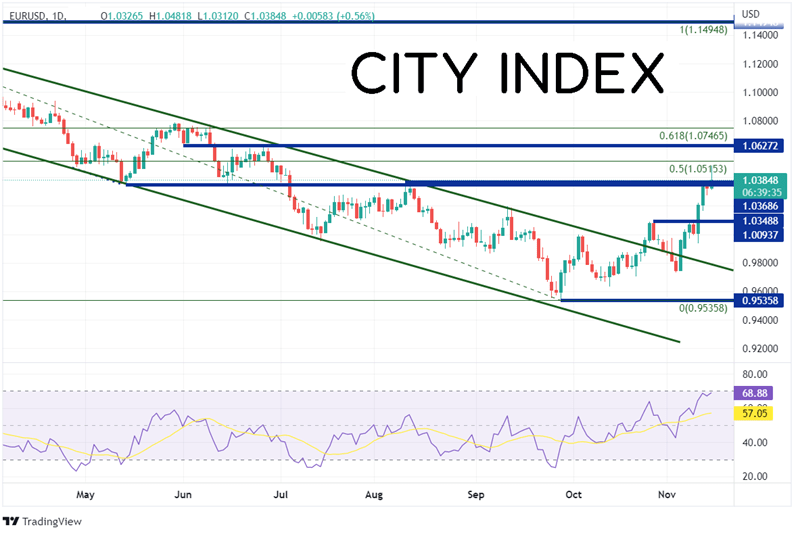
Source: Tradingview, Stone X
Trade EUR/USD now: Login or Open a new account!
• Open an account in the UK
• Open an account in Australia
• Open an account in Singapore
On a 240-minute timeframe, the 50% retracement level from the February highs to the September lows crosses just above at 1.0515. Above there, the next level of resistance is at the lows of June 1st at 1.0627 and then the 61.8% Fibonacci retracement level from the recently mentioned timeframe at 1.0747. Support sits just below at the previous resistance zone of 1.0350/70. Below there EUR/USD can fall to previous highs at 1.0094. The next support level is the lows from November 10th at 0.9936.
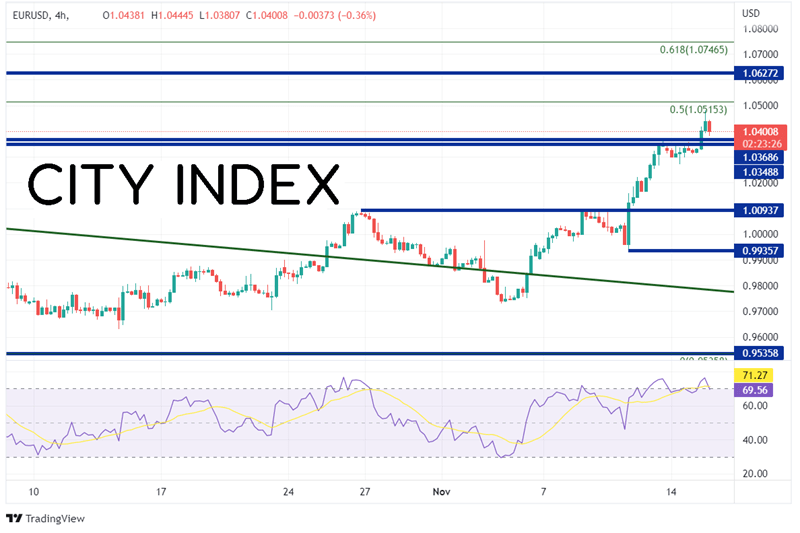
Source: Tradingview, Stone X
The lower-than-expected PPI print for October is consistent with the CPI from last week. Both are pointing towards a slowdown in the pace of interest rate hikes for the Fed, to 50bps from 75bps. However, Core PCE and another CPI print will be released before then. Keep an eye on the inflation data to see if there is anything that may cause the Fed to hike by more than 50bps!
Learn more about forex trading opportunities.
Latest market news
Yesterday 01:32 PM
Yesterday 09:35 AM
Yesterday 07:23 AM
Yesterday 04:48 AM
Yesterday 12:17 AM
July 25, 2024 10:39 PM
Latest Trade Ideas articles

Yesterday 09:35 AM

Yesterday 12:17 AM

July 25, 2024 10:39 PM

July 25, 2024 05:30 PM