


November 8, 2022 4:48 PM

When is the October US CPI report?
The US release of the October CPI report is scheduled to be released on Thursday, November 10th at 8:30am ET.
What are economists expecting for the October US CPI?
Consensus expectations are for the headline CPI to print at 8.0% YoY, with the Core CPI reading expected at 6.5% YoY.
US CPI preview
The September headline inflation was 8.2% YoY, higher than expectations of 8.1% YoY, however lower than the August reading of 8.3% YoY. The Core CPI reading was higher than expected at 6.6% YoY vs expectations of 6.5% YoY and an August reading of 6.3% YoY. This was the highest reading since 1982!
The Fed has a dual mandate of price stability and maximum sustainable employment. With the labor market remaining strong, the Fed is focused on price stability, and has maintained that lowering inflation is its number one priority. During the press conference that followed the FOMC statement on November 2nd, Fed Chairman Powell noted that incoming data suggests that the ultimate level of rates will be higher than previously anticipated. In addition, he said that “how high to raise rates is more important than the pace of tightening”. These statements imply that the Fed believes inflation will remain higher for longer. But has the four consecutive 75bps rate hikes finally fed through to the real economy? If so, inflation may be lower than expected, which should lift stock prices and lower the value of the US Dollar.
Everything you need to know about the Federal Reserve
Pair to Watch: EUR/USD
If the inflation data is weaker than expected, one could expect that the US Dollar would move lower. Therefore, EUR/USD could be expected to move higher. The pair had been in a downward sloping channel since February 2022, when it peaked at 1.1495. On September 28th, the pair reached a low of 0.9536 before bouncing back to 1.0000. Since then, the EUR/USD has been trading sideways between 0.9705 and 1.0094, while moving above the top, downward sloping trendline of the channel.
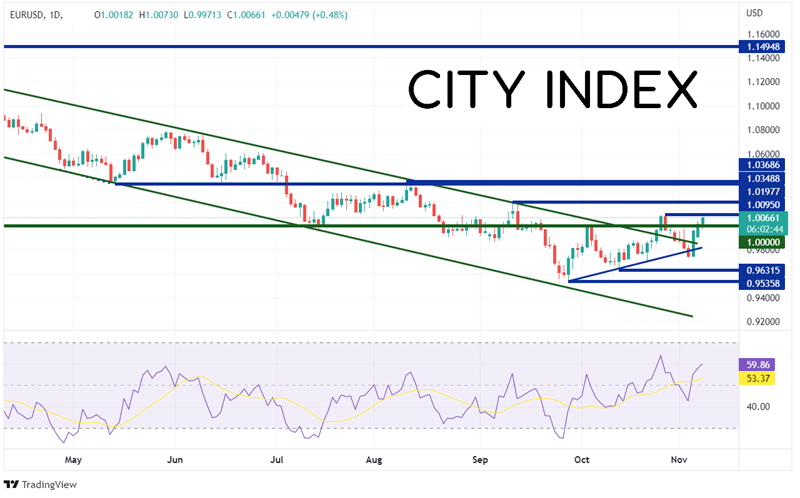
Source: Tradingview, Stone X
Trade EUR/USD now: Login or Open a new account!
• Open an account in the UK
• Open an account in Australia
• Open an account in Singapore
On a 240-minute timeframe, EUR/USD has been moving higher since the US Non-Farm payroll data on November 4th. The first resistance is at the highs from October 26th at 1.0094. Above there is a confluence of resistance at the highs from September 12th and the 127.2% Fibonacci extension from the lows of September 28th to the highs of October 26th between 1.0193 and 1.0198. The 161.8% Fibonacci extension from the same timeframe is the next level of resistance at 1.0318. If the data is higher than expected, EUR/USD could go lower. First support is at the low of November 8th at 0.9972. Below there, price can fall to the top trendline of the long-term channel near 0.9840 and then the low of November 3rd at 0.9730.
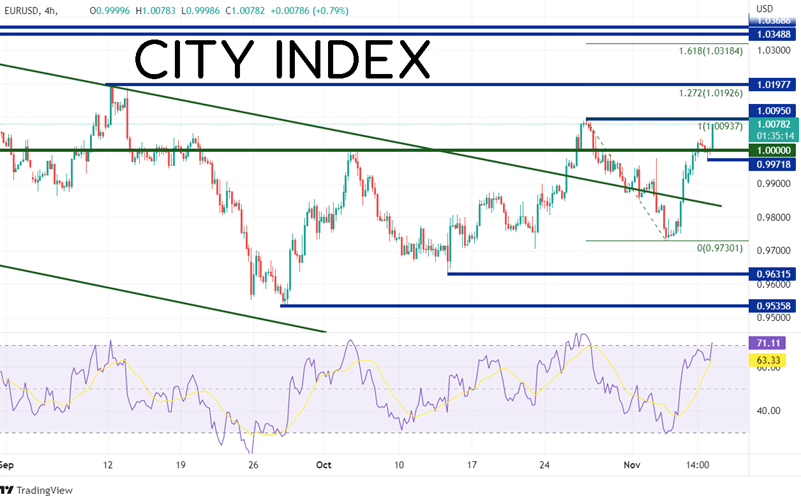
Source: Tradingview, Stone X
The headline CPI for October is expected to be 8%, while the core rate is expected to be 6.5%. The risk is that the prints come out higher than expected and high inflation lingers. The Fed said the terminal rate will be higher than previously expected. The CPI print could be the first clue as to what the FOMC will do at its December meeting!
Learn more about forex trading opportunities.
Latest market news
Yesterday 01:32 PM
Yesterday 09:35 AM
Yesterday 07:23 AM
Yesterday 04:48 AM
Yesterday 12:17 AM
July 25, 2024 10:39 PM
Latest Trade Ideas articles

Yesterday 09:35 AM

Yesterday 12:17 AM

July 25, 2024 10:39 PM

July 25, 2024 05:30 PM