


February 24, 2023 4:08 PM

With strong inflation data lately and Fed speakers remaining hawkish, many traders were expecting the Fed’s favorite measure of inflation, Core PCE, to come in hotter than expected. They weren’t disappointed. The MoM Core PCE jumped to 0.6% vs an expectation of 0.4% and a higher revised print for December from 0.3% to 0.4%. The January print was the highest reading for the MoM Core PCE since August. In addition, the YoY Core PCE Price Index rose to 4.7% YoY vs 4.3% YoY expected and a revised December print from 4.4% to 4.6%. This data helps to back the Fed’s thinking that rates need to continue to rise and then be held for a longer period of time. Recall from the FOMC Minutes released on Wednesday that most of the participants at the December meeting thought it was appropriate to raise rates by 25bps, and some even felt that 50bps was a possibility.
On a daily timeframe, the US Dollar Index had bottomed on February 2nd at 100.85 after peaking on September 29th, 2022, at 114.79. Price has been moving higher since then, breaking above the 50 Day Moving Average as well as a long term trendline dating to March 2021 (red line). With price up nearly 60 pips today, the DXY is approaching the 38.2% Fibonacci retracement from the highs of November 3rd, 2022 to the lows of February 2nd at 105.53. The 200 Day Moving Average and a downward sloping trendline converge above there near 106.47, then the 50% retracement of the above-mentioned timeframe at 106.98. First support is at today’s low and the long-term trendline at 104.42. Below there, horizontal support crosses at the lows of February 20th at 103.76, then the 50 Day Moving Average at 103.33.
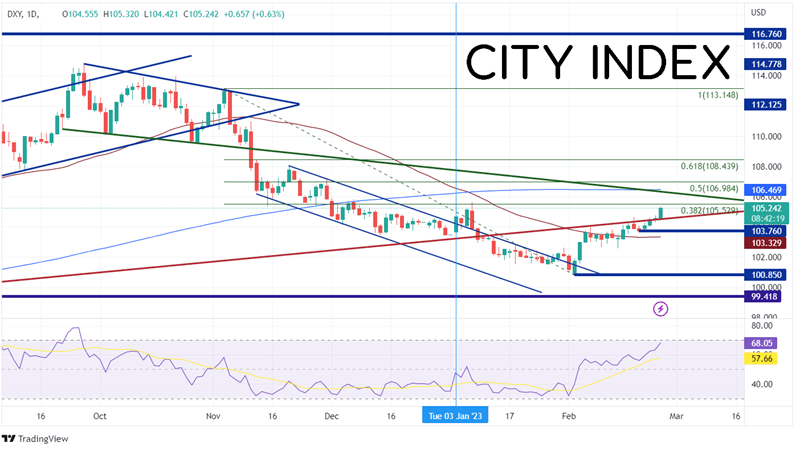
Source: Tradingview, Stone X
Trade the DXY now: Login or Open a new account!
• Open an account in the UK
• Open an account in Australia
• Open an account in Singapore
EUR/USD makes up nearly 57% of the US Dollar Index. Therefore, when the DXY moves in one direction, EUR/USD usually moves in the opposite direction. The pair had been moving higher since making lows on September 28th, 2022, at 0.9536. EUR/USD then moved higher, reaching a near-term peak at 1.1033 on February 2nd. Since then, the pair has pulled back, breaking through the 50 Day Moving Average and the bottom trendline of an upward sloping channel near 1.0720. With price down nearly 50 pips today, EUR/USD is approaching the 38.2% Fibonacci retracement from the low of November 3rd, 2022 to the high of February 2nd, at 1.0535. If price continues lower, the next support is the lows from January 6th at 1.0482, then the 50% retracement level from the above-mentioned timeframe at 1.0382.
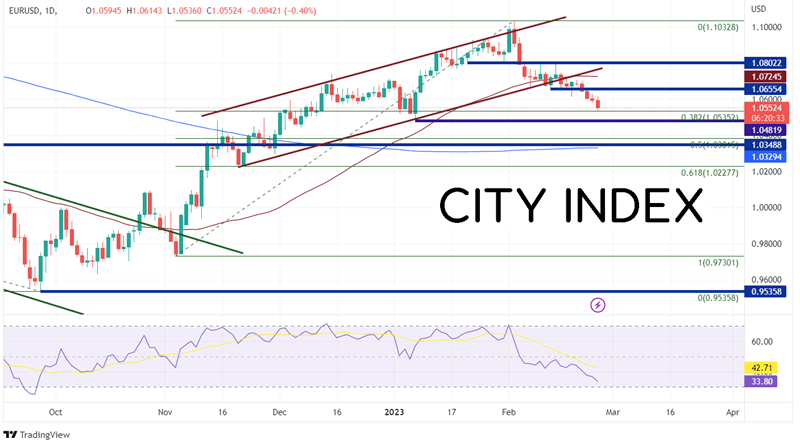
Source: Tradingview, Stone X
Trade EUR/USD now: Login or Open a new account!
• Open an account in the UK
• Open an account in Australia
• Open an account in Singapore
With the US Core PCE for January hotter than expected, the US Dollar is continuing its recent rise. The print confirms the Fed’s thinking that rates need to continue to be raised and will be held steady for a longer period of time. EUR/USD makes up a large percentage of the DXY, and therefore, moves in the opposite direction of the US Dollar. Watch to see if it can hold the key support levels just below.
Learn more about forex trading opportunities.
--- Written by Joe Perry, Senior Market Strategist
Follow me on Twitter at @JoeP_FOREXcom
Latest market news
Yesterday 01:32 PM
Yesterday 09:35 AM
Yesterday 07:23 AM
Yesterday 04:48 AM
Yesterday 12:17 AM
July 25, 2024 10:39 PM
Latest Trade Ideas articles

Yesterday 09:35 AM

Yesterday 12:17 AM

July 25, 2024 10:39 PM

July 25, 2024 05:30 PM