


FTSE falls after hot UK inflation
- UK CPI rises to 10.4%
- BoE likely to hike rates tomorrow
- FTSE caught between 200 & 100 sma
The FTSE is falling after inflation unexpectedly rose in February. UK CPI thanks to 10.4% YoY, up from 10.1% in January. Expectations had been for a decline to 9.9%.
Meanwhile, core CPI, also rose to 6.2%, up from 5.8% and well ahead of the fall to 5.7% forecast.
The data comes ahead of the BoE rate decision tomorrow, where the central bank will now likely hike rates by 25 basis points marking the 11th straight hike. Prior to the CPI reading, the decision was looking more 50 /50 as to whether the BoE would hike or keep rates on hold.
With inflation so hot, the central bank can’t not hike rates, despite the recent stresses in the banking sector.
Higher rates for longer will mean that the squeeze on household incomes continues, which is particularly bad news for discretionary stocks on the index. Meanwhile, the defensives could benefit from the risk off mood.
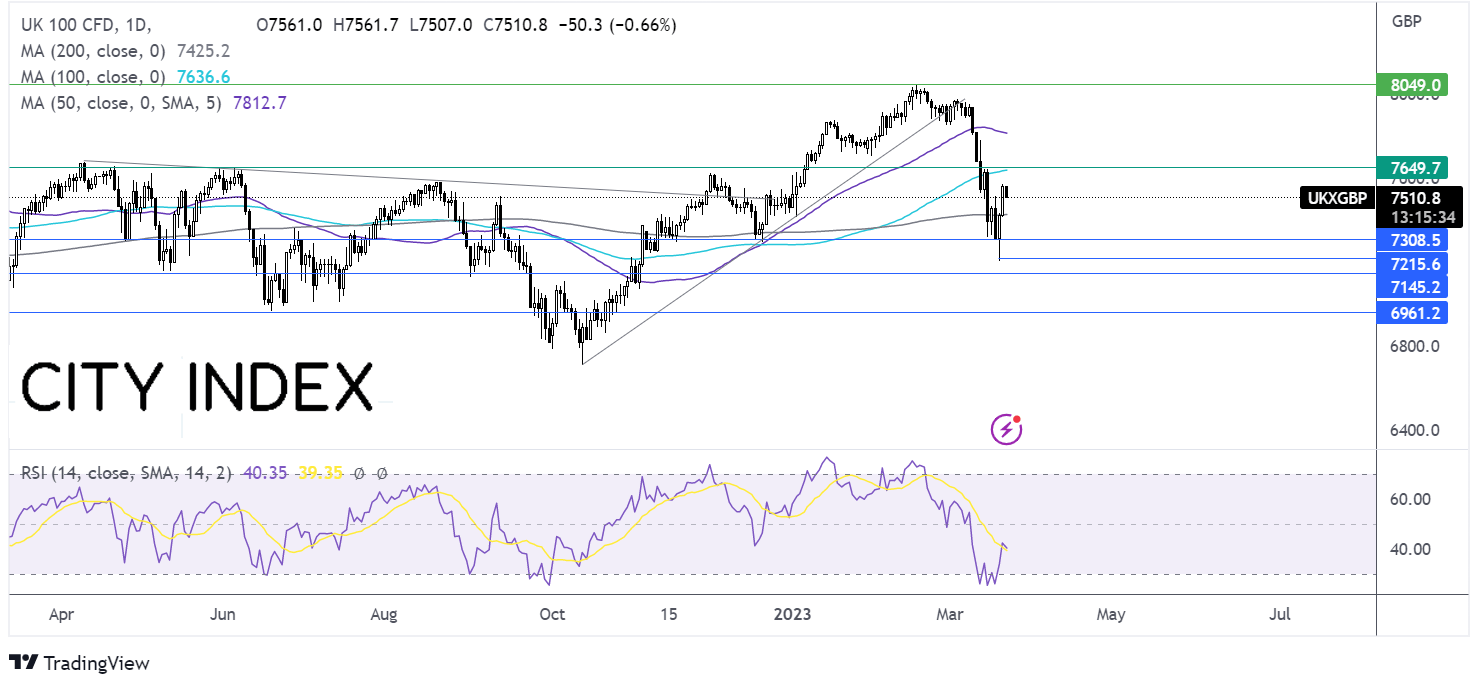
Where next for the FTSE?
After rebounding from the 7200 2022 low, the FTSE trades caught between the 200 and 100 sma. However, the long lower wick suggests that there wasn’t much demand at the lower level. That said the RSI below 50 supports further downside.
The 200 sma is a key support, a break below here is needed to retest 7300, a level that has offered support on several occasions over the past year. A break below here opens the door to 7200, the 2023 low.
Meanwhile, buyers could look for a rise above the 7635 the 100 sma and the June high, to extend gains towards the 50 sma at 7800.
USD/JPY tests the 50 sma ahead of the Fed rate decision
- Improved market mood pulls on yen
- Fed expected to hike rates 50 bps
- USD/JPY tests 50 sma resistance
USD/JPY is holding steady in cautious trade ahead of the Federal Reserve rate decision.
The market is pricing in a 90% probability of the Fed hiking rates by 25 basis points later today as the central bank continues its struggle to bring inflation, which is still 3 tines the Fed’s target rate under control.
This is down from a 50 basis point hike that was expected a few weeks ago. The repricing of expectations was owing to the stress unfolding in the banking sector.
While banking crisis fears had supported the safe haven yen, those fears have eased, weighing on the yen.
In addition to the rate hike, investors will be looking at the quarterly projections and the dot plot for further clues over the Fed’s future path for hikes. The market expects a 50 bps rate cut by the end of the year. A less hawkish-sounding Fed could support this view and drag on the USD.
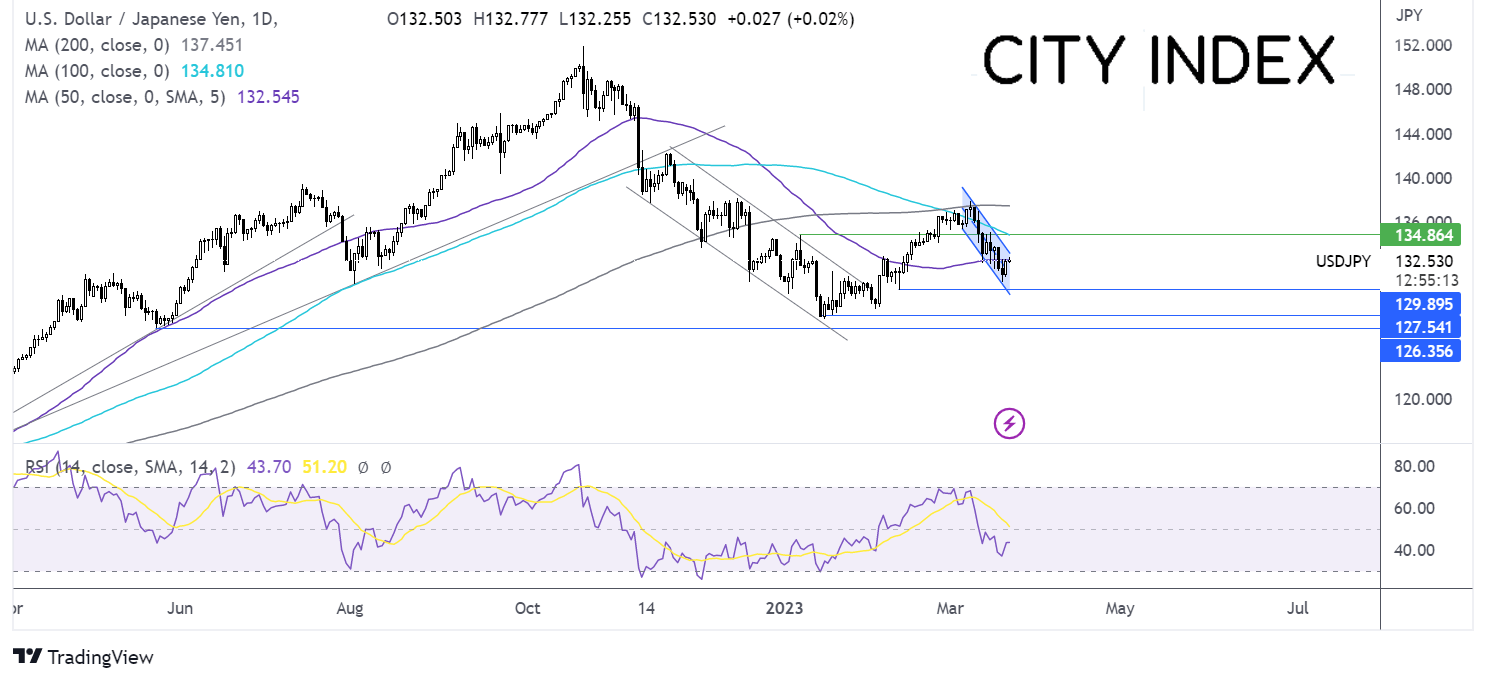
Where next for the USD/JPY?
USD/JPY is taking in a falling channel dating back to the start of the month. The price rebounded off the lower band of the channel and is testing resistance at the 50 sma at 132.60.
A rise above the 50 sma is needed to bring the upper band of the channel into play at 133.75. A rise above here exposes the 100 sma.
On the flip side, should sellers successfully defend the 50 sma, the pair could look towards 129.80 round number and the lower band of the falling channel.
Latest market news
Yesterday 01:32 PM
Yesterday 09:35 AM
Yesterday 07:23 AM
Yesterday 04:48 AM
Yesterday 12:17 AM
July 25, 2024 10:39 PM
Latest Trade Ideas articles

Yesterday 09:35 AM

Yesterday 12:17 AM

July 25, 2024 10:39 PM

July 25, 2024 05:30 PM