


As we mentioned the possibility in at least two of our report the day before, the stock market recovery was at risk of a reversal. Lo and behold, we have seen a sharp sell-off today, led by the German DAX index with a fall of nearly 2%. US markets have opened sharply lower after future skidded along with their European peers. They could extend their losses in the event the FOMC’s last meeting minutes, due for release later, reveal a more hawkish-than-expected Fed.
Insofar as today’s stock market drop is concerned, there was no obvious single trigger behind the sell-off, although that big inflation print in the UK did little to calm investor concerns about stagflation. Earlier in the week, we had another very poor ZEW survey reading from Germany, where concerns are growing that that additional energy costs for households and businesses will weaken an already struggling economy in the months ahead. Indeed, it is progressively becoming difficult for investors to justify maintaining an optimistic view on the stock markets given a challenging global macro-outlook. This was evidenced, for example, by a poor Empire Fed Manufacturing Index print and weak Chinese industrial and retail sales data on Monday, reminding us that it is not just Eurozone that is struggling for growth.
Against this backdrop, today’s sell-off should surprise no one.
Russell back below 200-day is a bearish signal
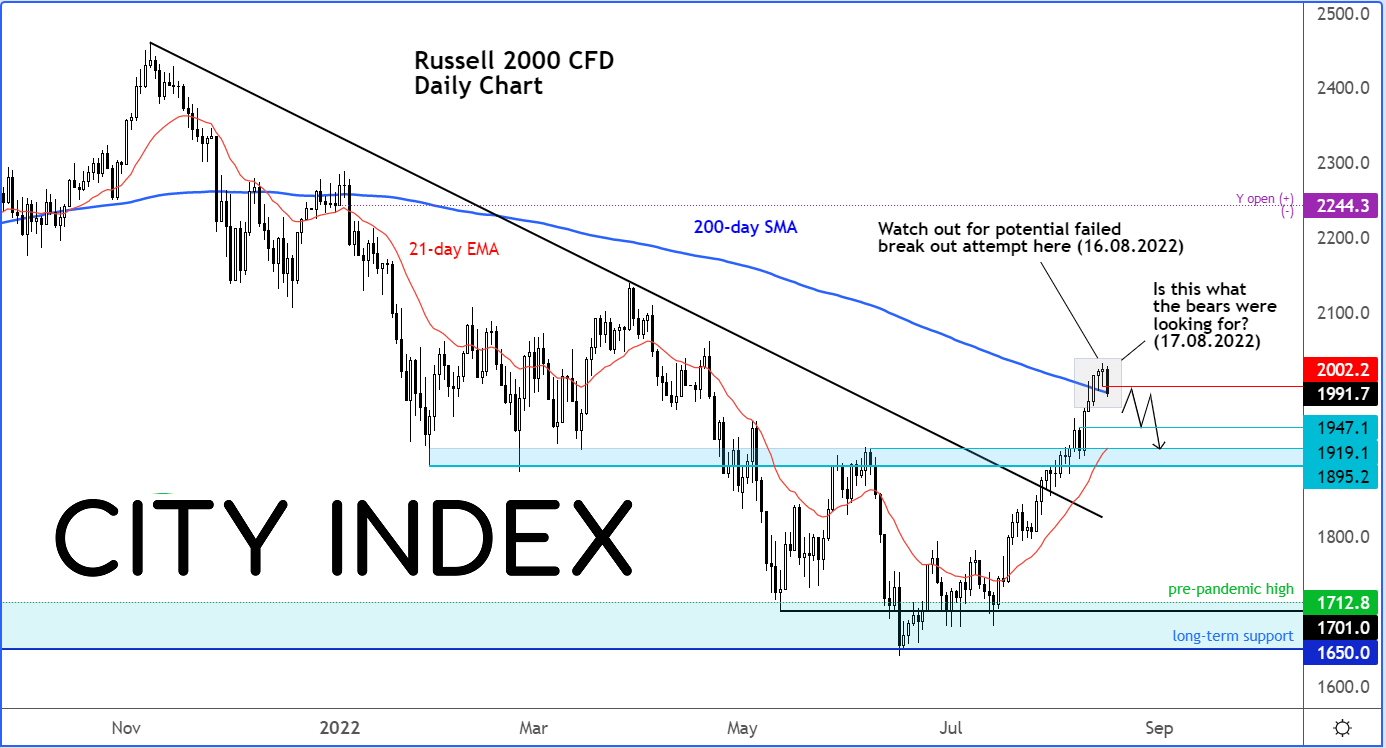
As per our analysis in the Technical Tuesday report (which we publish and update the same link every week), US indices have indeed turned around, with the S&P finding strong resistance from the 200-day moving average. With a not-so-great macro backdrop, we were always going to get at least some long-side profit-taking around these levels. But if the weakness holds into the close, then this will likely lead to further follow-up technical selling in the days ahead.
Along with the SPX, it is worth watching the Russell as well, for it has – for now – refused to hold above its 200-day average, which looks like a typical failed breakout scenario. A close around current levels or lower would be considered bearish.
How to trade with City Index
You can trade with City Index by following these four easy steps:
-
Open an account, or log in if you’re already a customer
• Open an account in the UK
• Open an account in Australia
• Open an account in Singapore
- Search for the company you want to trade in our award-winning platform
- Choose your position and size, and your stop and limit levels
- Place the trade
Latest market news
Yesterday 01:32 PM
Yesterday 09:35 AM
Yesterday 07:23 AM
Yesterday 04:48 AM
Yesterday 12:17 AM
July 25, 2024 10:39 PM
Latest Trade Ideas articles

Yesterday 09:35 AM

Yesterday 12:17 AM

July 25, 2024 10:39 PM

July 25, 2024 05:30 PM