


Spot natural gas trades at 7 week high
Natural gas prices are trading up 4% so far today and are at the highest level since early February. Putting this into context spot natural gas prices are double what they were this time last year.
Concerns over supply amid the ongoing Russian war are exasperating an already tight market.
In the latest developments, the headlines following the NATO meeting today revealed that the group agreed to strengthen forces in eastern Europe, increase aid to Ukraine and tighten sanctions on Moscow - moves which are likely to strain relations further.
Yesterday, Putin announced that payment for natural gas will be switched to Russian roubles, in an effort to boost the national currency. However, he stressed that Russia would continue to supply energy resources.
Europe depends on Russian gas for 40% and is now in the difficult position of choosing between its own energy security or propping up the Russian currency.
Gas futures which are tied to TTF, Europe’s wholesale gas price, closed 9% higher yesterday. The move in spot natural gas was more modest.
The switch is unlikely to be simple. It would seem likely that contracts would need to be renegotiated from current terms of payment which are euros. Even so, this has been a key point in the war so far. It shows that Putin is prepared to risk ongoing gas contracts as the war deepens and the confrontation with the West escalates.
This is uncharted territory and is placing upward pressure on gas prices.
Learn more about trading natural gasWhere next for spot natural gas?
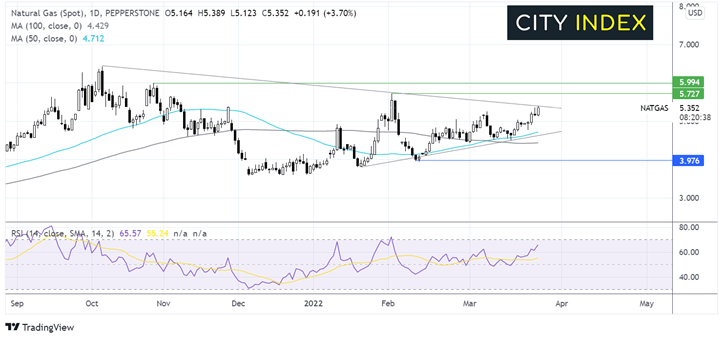
Spot natural gas trades within a triangle pattern and appears to be on the verge of a break-out. The price has been steadily climbing, supported by the 50 SMA and the multi-week rising trendline.
Today’s pop higher has taken the price to the multi-month falling trendline resistance. The RSI is supportive of further upside.
A break above the falling trendline could see the price breakout towards 5.727 2022 high, before bringing 5.991 the October high into focus.
Failure to break out the rising trendline could see the price rebound lower back towards the rising trendline and the 50 sma at 4.713. A move below here would expose the 100 sna at 4.430; a move below here could see the near-term bias change to bearish, bringing 3.975 into play.
How to trade with City Index
Follow these easy steps to start trading with City Index today:
- Open a City Index account, or log-in if you’re already a customer.
- Search for the market you want to trade in our award-winning platform.
- Choose your position and size, and your stop and limit levels
- Place the trade.
Latest market news
Yesterday 01:32 PM
Yesterday 09:35 AM
Yesterday 07:23 AM
Yesterday 04:48 AM
Yesterday 12:17 AM
July 25, 2024 10:39 PM
Latest Commodities articles

July 22, 2024 02:47 AM

July 18, 2024 12:48 AM

July 15, 2024 01:00 AM

July 13, 2024 12:00 PM