


February 9, 2022 4:20 PM

Mexico’s CPI decreased for the second time in as many months to 7.07% YoY in January from 7.36% YoY in December and 7.02% YoY expected. However, the Core Inflation Rate for January increased to 6.21% YoY in January from 5.94% YoY in December and 6.16% YoY expected. The core inflation is at its highest level since September 2001! Note that the Bank of Mexico target’s 3% inflation.
Everything you need to know about Emerging Market Currencies
What will the Bank of Mexico (Banxico) take away from the inflation data when they meet on Thursday? At the December meeting, the Banxico surprised the market by hike 50bps to 5.5%. A 25bps hike was expected. Markets are expecting another 50bps hike at the meeting tomorrow. It should also be noted that there is a new Governor at the Bank of Mexico, Victoria Rodriguez Caja. She has a tough task ahead of her as she tries to lower inflation without hurting the economy.
Trade USD/MXN now: Login or Open a new account!
• Open an account in the UK
• Open an account in Australia
• Open an account in Singapore
USD/MXN had been in a downward sloping triangle since the beginning of the pandemic in March 2020, forming a strong base between 19.5527 and 19.7062. The pair then broke above the descending line of the triangle on September 28th and continued higher to the 38.2% Fibonacci retracement level from the March 2020 highs to the January 20th, 2021 lows near 22.00. The pair had been moving lower since in a descending wedge formation, breaking out on January 18th. USD/MXN then retraced to a confluence of resistance on January 28th just below the 38.2% Fibonacci retracement level from the November 26th, 2021 spike to the January 17th low, horizontal resistance, and the 200 Day Moving Average. This range is between 20.80 and 21.00. The pair has been moving lower since.
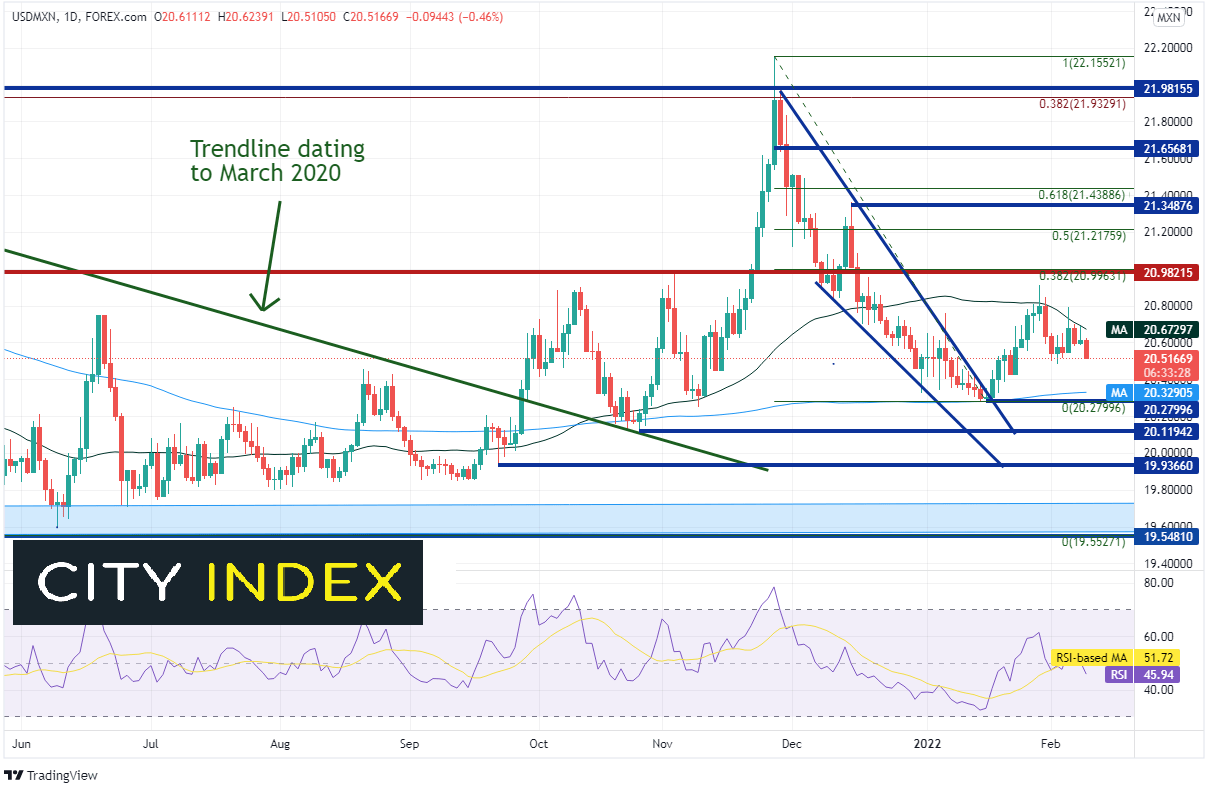
Source: Tradingview, Stone X
On a 240-minute timeframe, USD/MXN is nearing support at the February 2nd lows near 20.4811. Below there, long-term horizontal support is at 20.1194, then the top of the band of support (see daily) at 19.7062, A confluence of resistance is just above at a short-term downward sloping trendline dating to January 28th near 20.6550 and the 200 Day Moving Average at 20.6724. Above there, price can move to the January 28th highs at 20.9144, then the previously mentioned 38.2% Fibonacci retracement near 20.9949.
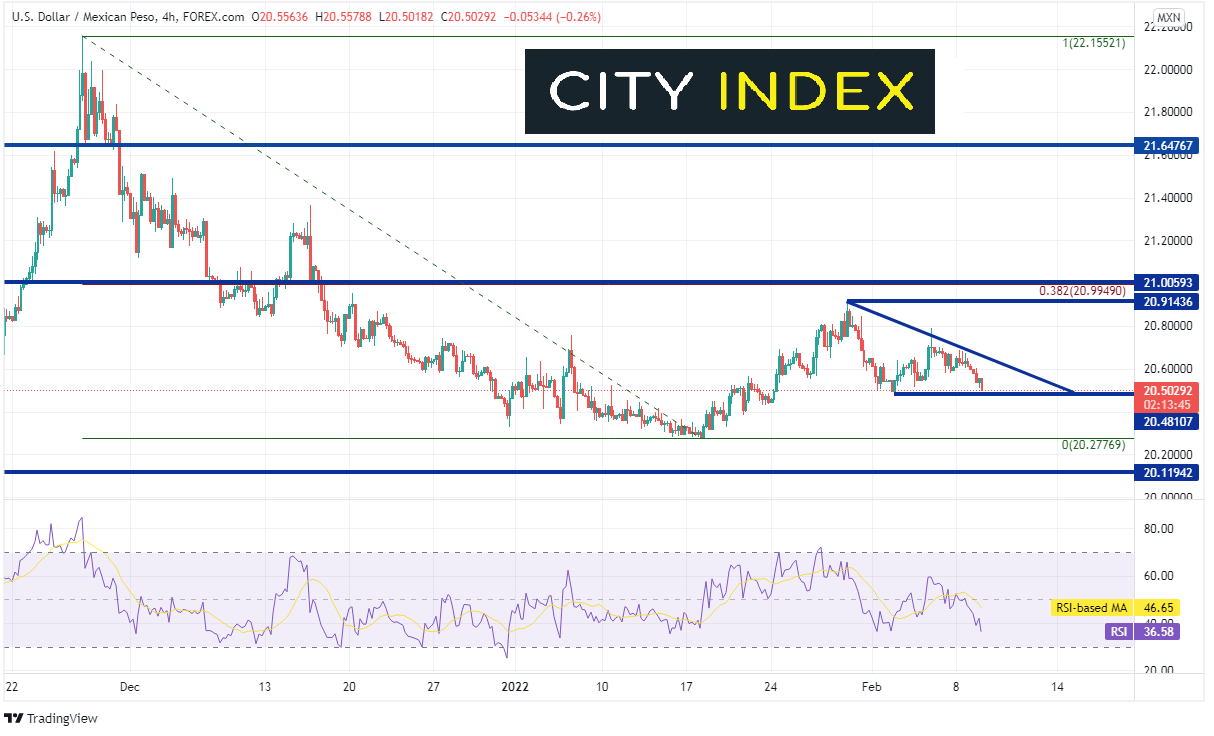
Source: Tradingview, Stone X
January headline CPI was weaker than December’s while the Core CPI was stronger. How will Banxico interpret this data? The central bank meets tomorrow and a 50bps hike is expected. There is also a new central bank Governor. The question traders need to ask is: Will the CPI data cause central bank members to change their views?
Learn more about forex trading opportunities.
Latest market news
Yesterday 01:32 PM
Yesterday 09:35 AM
Yesterday 07:23 AM
Yesterday 04:48 AM
Yesterday 12:17 AM
July 25, 2024 10:39 PM
Latest Trade Ideas articles

Yesterday 09:35 AM

Yesterday 12:17 AM

July 25, 2024 10:39 PM

July 25, 2024 05:30 PM