


October 29, 2021 3:58 PM

Although Christine Lagarde seemed to mince words at yesterday’s ECB press conference following the Monetary Policy meeting, one thing was for sure: Inflation was the focus of the ECB’s meeting! Earlier, the EU released its CPI Flash for the month of October. The headline YoY print was 4.1% vs 3.7% expected and 3.4% last. This was the highest reading since July 2008. The core CPI YoY, which excludes food and energy, was 2.1% vs an expectation of 1.9% expected and 1.9% in September. This was the highest reading since December 2002. Thus, the ECB was correct to be worried about inflation!
The ECB isn’t the only one’s who are concerned about inflation! The US Fed meets next week, and inflation is sure to be a hot topic as the Fed has all but directly stated they will announce the beginning of tapering their bond buying program at this meeting. The Fed’s favorite measure of inflation, Core PCE, was released today for September. The YoY print was 3.6% vs 3.7% expected, and 3.6% in August and July. This is an indication that inflation may be stabilizing! Although it missed slightly, it is sill much higher than the Fed would like it. The headline print YoY was 4.4% vs 4.4% expected and 4.2% in August. While we’re on the topic of inflation, we should also point out that the Employment Cost Index QoQ for Q3 was 1.3% vs and expectation of 0.9% and 0.7% in Q2.
Everything you need to know about the Federal Reserve
After the ECB meeting, EUR/USD went bid, up 75 pips on the day and closing at 1.1692. The pair was halted at the 50 Day Moving Average and a downward sloping trendline dating back to May 26th! After the US PCE data was released, it was the US Dollar’s turn to go bid, which pulled EUR/USD lower. If EUR/USD closes today below 1.1595, the candlestick pattern would be a bearish engulfing pattern, which is a reversal pattern. It could lead to a test of the 15-month lows at 1.1525. Support is at yesterday’s lows of 1.1582 and then the lows of October 12th at 1.1525. Just below there is the 161.8% Fibonacci extension from the August 19th lows to the September 3rd highs at 1.1515, and horizontal support dating back to March 2020 at 1.1495. Resistance is at the confluence yesterday’s highs, and the previously mentioned 50 Day Moving Average and downward sloping trendline between 1.1692 and 1.1705.
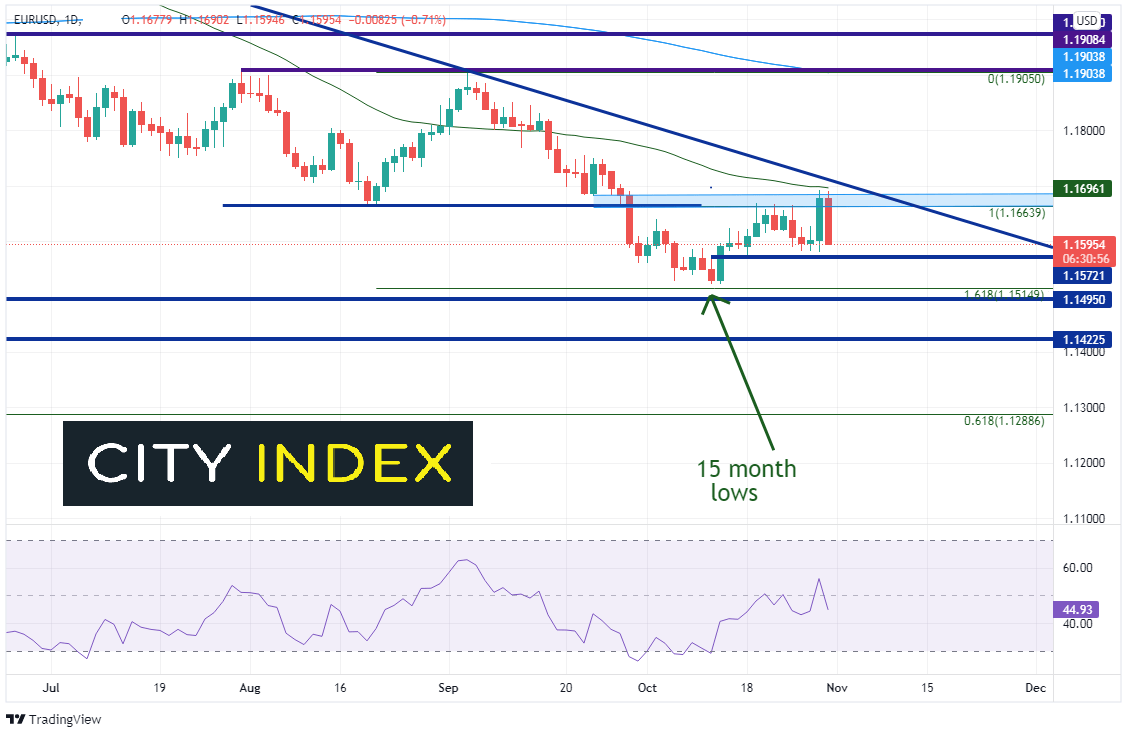
Source: Tradingview, Stone X
Trade EUR/USD now: Login or Open a new account!
• Open an account in the UK
• Open an account in Australia
• Open an account in Singapore
As inflation data continues to remain excessively high in the US, Europe, and around the world, central banks are struggling to justify that a majority of the inflation is transitory. But at the end of the day, the currency that will be the least volatile will be the one with a central bank who can control inflation expectations the best!
Learn more about forex trading opportunities.
Latest market news
Yesterday 01:32 PM
Yesterday 09:35 AM
Yesterday 07:23 AM
Yesterday 04:48 AM
Yesterday 12:17 AM
July 25, 2024 10:39 PM
Latest Trade Ideas articles

Yesterday 09:35 AM

Yesterday 12:17 AM

July 25, 2024 10:39 PM

July 25, 2024 05:30 PM