


July 25, 2022 8:38 PM

According to Investopedia, the Dow Jones Industrial Average (or simply, the Dow) is a price-weighted index that tracks 30, large, publicly owned companies trading on the NYSE and the NASDAQ. The next direction of the Dow may not hinge as much on the outcome of the FOMC meeting on Wednesday as it will on many of the companies in the large cap index due to release earnings this week. Companies such are 3M, Apple, Boeing, Caterpillar, Chevron, Coca-Cola, Honeywell, Intel, Merck, McDonalds, Microsoft, Proctor and Gamble, and Visa all report earnings this week. The guidance of these firms, including whether these large firms see continued inflation or a recession ahead, have influence over many firms. Therefore, if these firms see lower earnings ahead, many others are likely to as well. But where can the Dow go from here?
On a weekly timeframe, the Dow Jones Industrial Average made a pandemic low in March 2020 near 18214. Like many of the other stock indices, the Dow took off from there as it was apparent the Fed would have an extremely accommodative monetary policy stance during the months ahead as the world went through the Coronavirus pandemic. During the first week of 2022, the Dow made an all-time high at 36952.65, a 100% gain from the pandemic lows. The large cap index then pulled back to the 38.2% Fibonacci retracement level from the pandemic lows to the January highs, near 29653 during the week of June 13th. Since then, price has bounced marginally as it waits for the next catalyst.
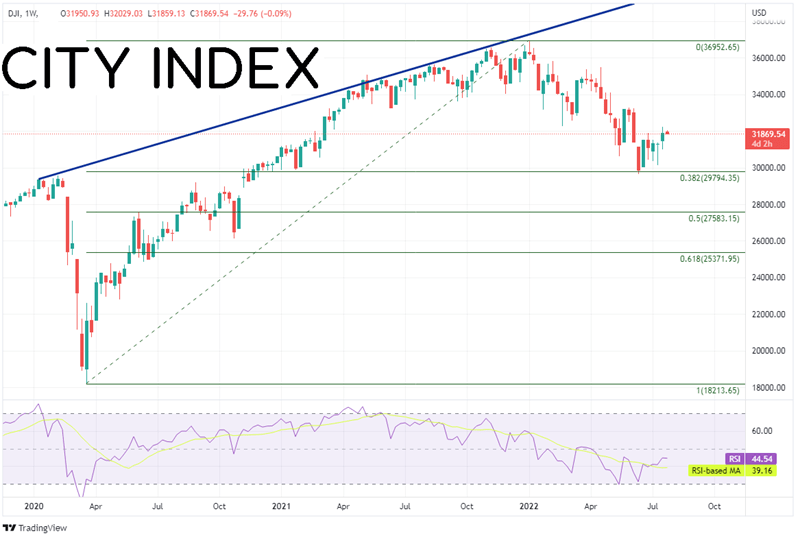
Source: Tradingview, Stone X
Trade the Dow now: Login or Open a new account!
• Open an account in the UK
• Open an account in Australia
• Open an account in Singapore
On a daily timeframe, the Dow
pulled back from the all-time highs in an orderly downward sloping channel, twice trying to break above it, once at the end of March and again on April 19th, only to fail and pull back inside both times. Price is currently testing the top trendline once again near 31900. If price moves above the trendline, the first resistance is at the 38.2% Fibonacci retracement from the all-time highs of the June 17th lows near 32442. Above there, is a confluence of horizontal resistance and the 50% retracement level from the same timeframe near 32303/33241. The next resistance is another confluence at the 61.8% Fibonacci retracement and additional horizontal resistance at 34102/34164. However, if the resistance holds, first support is nearby at 31511. Below there, price can fall to the June 17th lows at 29653, and then the bottom trendline of the downward sloping channel, near 28800.
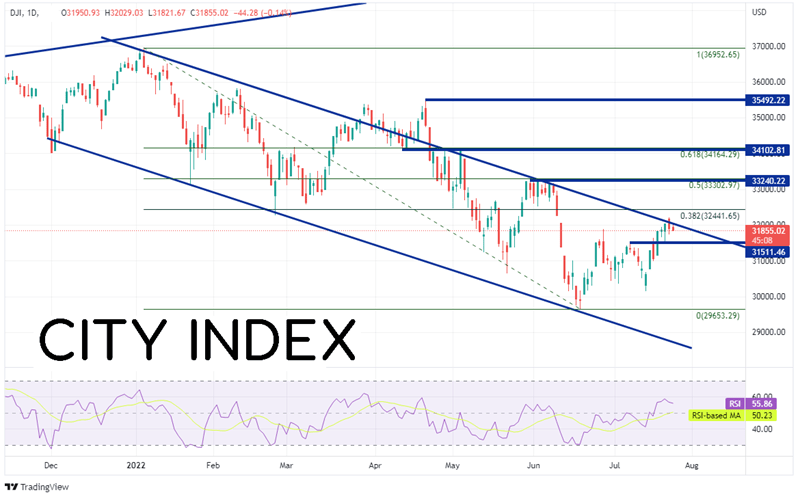
Source: Tradingview, Stone X
Many of the companies in the Dow Jones Industrial Average report earnings this week. Possibly even more important than this week’s FOMC meeting, the earnings of these firms could provide the next direction for the large cap index.
Learn more about index trading opportunities.Latest market news
Yesterday 01:32 PM
Yesterday 09:35 AM
Yesterday 07:23 AM
Yesterday 04:48 AM
Yesterday 12:17 AM
July 25, 2024 10:39 PM
Latest Trade Ideas articles

Yesterday 09:35 AM

Yesterday 12:17 AM

July 25, 2024 10:39 PM

July 25, 2024 05:30 PM