


Market summary
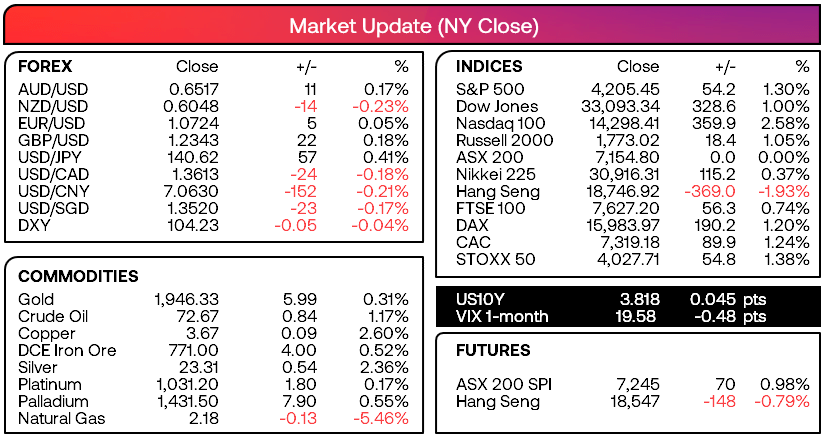
- Wall Street posted strong gains on Friday on reports that a debt-deal agreement was within sight
- Both President Biden and Republican House speaker McCarthy predicting on Sunday that the majority of their respective parties will back the deal
- But, time is still running short to get the deal over the line with Janet Yellen warning that cash will run out by June 5th
- The Nasdaq rallied from the open to reach a 13-month high and close the downside gap from April 2022, whilst the S&P 500 probed the prior week’s (YTD) high but remains just beneath the August 202 downside gap
The US dollar rose for a third week and against all other FX majors, USD/JPY hit a fresh YTD high and slightly extend those gains in early Monday trade
NZD was the weakest FX major following the RBNZ’s dovish 25bp hike, and bearish engulfing candles formed on all three commodity FX pairs (NZD, AUD and CAD)Risk-on trade helped oil prices recoup around half of Thursday’s losses, AUD/JPY rise to a 3-day high (and extend gains in early Asia - ~75% of economists polled by Reuters expect the BOJ to retain YCC control until at least next year, as bets the central bank will leave ultra-dovish policies subside
- Turkey’s President Erdogan sealed his victory in the election to begin his third decade in power
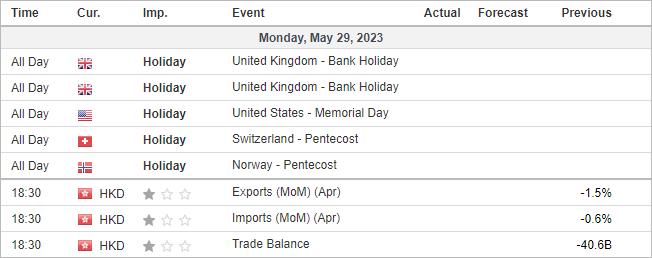
- No major economic data is scheduled for today
- Public holiday in Switzerland, UK and the US
View The Week Ahead for upcoming events and themes for this week
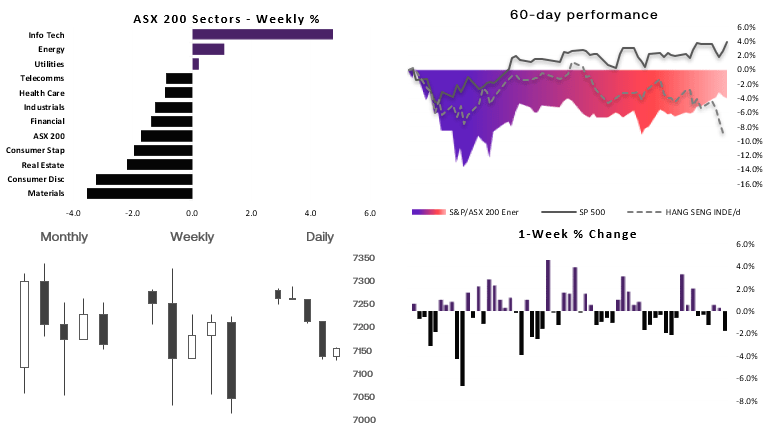
ASX 200 at a glance:
- Worst week in ten for the ASX 200
- 8 of the 11 sectors were lower last week, led by materials and consumer discretionary
- Yet the lows held above the 200-day MA
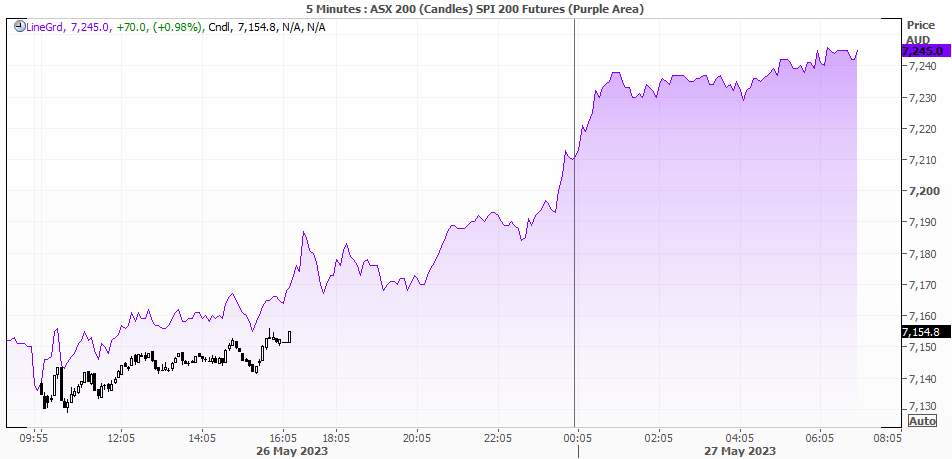
- The ASX 200 is expected to open above 7200 thanks to Friday’s risk-on rally on Wall Street
- We're now looking for a retest (and potential break above) 7300
Gold daily chart:
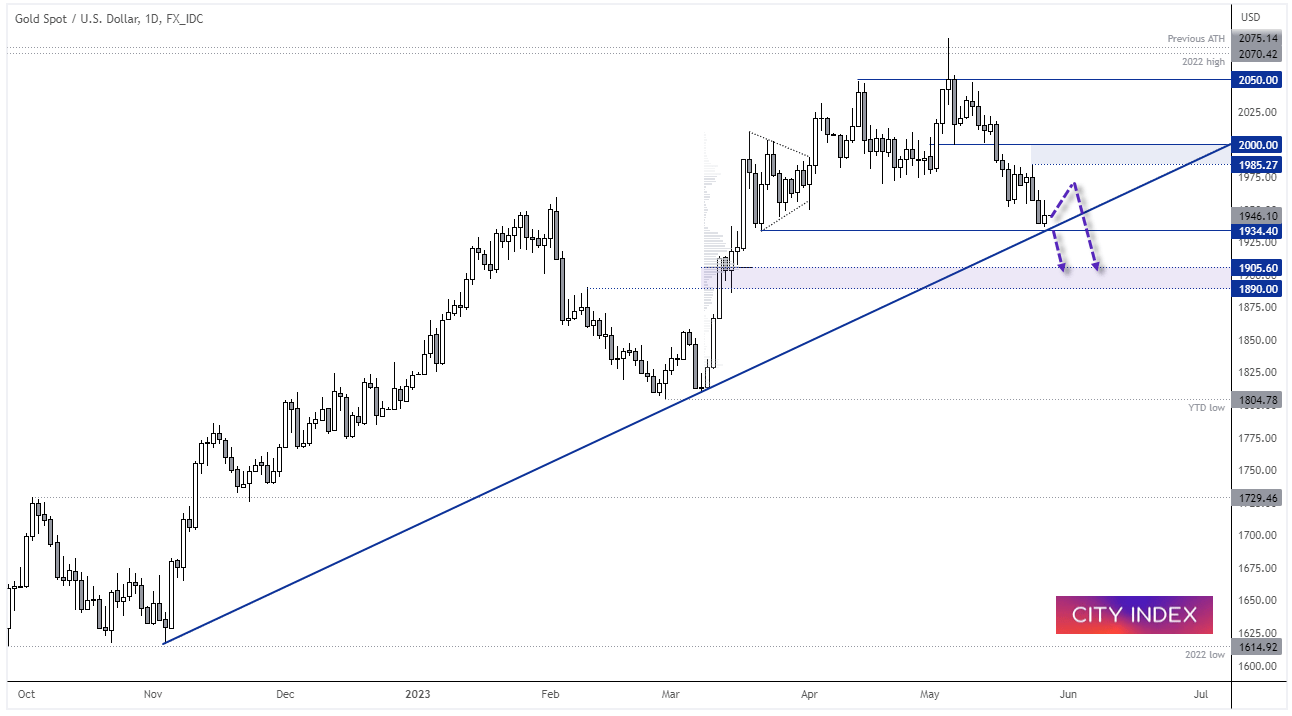
The lure for gold has dwindled since the US dollar regained its strength and odds of a debt-ceiling deal became more apparent. And we see the potential for further losses, but gold has reached a potential inflection point over the near-term. Prices are holding above the 1934.4 low and November trendline, and as Friday printed an inverted hammer then we’re on guard for a corrective bounce from current levels. At which point we’ll then look for evidence of a swing high and potential break of the 1934 area. Otherwise, a break beneath 1934 assumes bearish continuation.
Asia Data Calendar (AEDT):
-- Written by Matt Simpson
Follow Matt on Twitter @cLeverEdge
How to trade with City Index
You can trade with City Index by following these four easy steps:
-
Open an account, or log in if you’re already a customer
• Open an account in the UK
• Open an account in Australia
• Open an account in Singapore
- Search for the market you want to trade in our award-winning platform
- Choose your position and size, and your stop and limit levels
- Place the trade
Latest market news
Yesterday 01:32 PM
Yesterday 09:35 AM
Yesterday 07:23 AM
Yesterday 04:48 AM
Yesterday 12:17 AM
July 25, 2024 10:39 PM
Latest Trade Ideas articles

Yesterday 09:35 AM

Yesterday 12:17 AM

July 25, 2024 10:39 PM

July 25, 2024 05:30 PM