


The Dow Theory is a technical analysis framework developed by Charles Dow, a journalist and co-founder of Dow Jones & Company, in the late 19th century. It analyses market trends and price movements to predict the overall direction of the stock market.
One of the six tenants of the Dow theory was that “the averages must confirm” each other. This meant that if the Dow Jones Index (DJIA) broke to a new high, the breakout would be confirmed only once the Dow Jones Transportation Index (DJTI) followed suit. Conversely, if the DJT broke a key swing low to suggest a bearish downtrend, it would also requite the DJI to break its respective swing low to confirm it.
However, with modern society shifting towards a predominantly serviced-based economy, it could be argued that the transportation index is less relevant than it was. Moreover, with the S&P 500 a broader basket of stocks (even if heavily influenced by seven tech stocks) and the Nasdaq 100 sharing strong correlations with the Dow Jones and S&P 500, we can instead use a combination of the DJI, S&P 500 and Nasdaq 100 to modernise the Dow theory.
US indices compared (Dow Jones, Nasdaq 100, S&P 500)
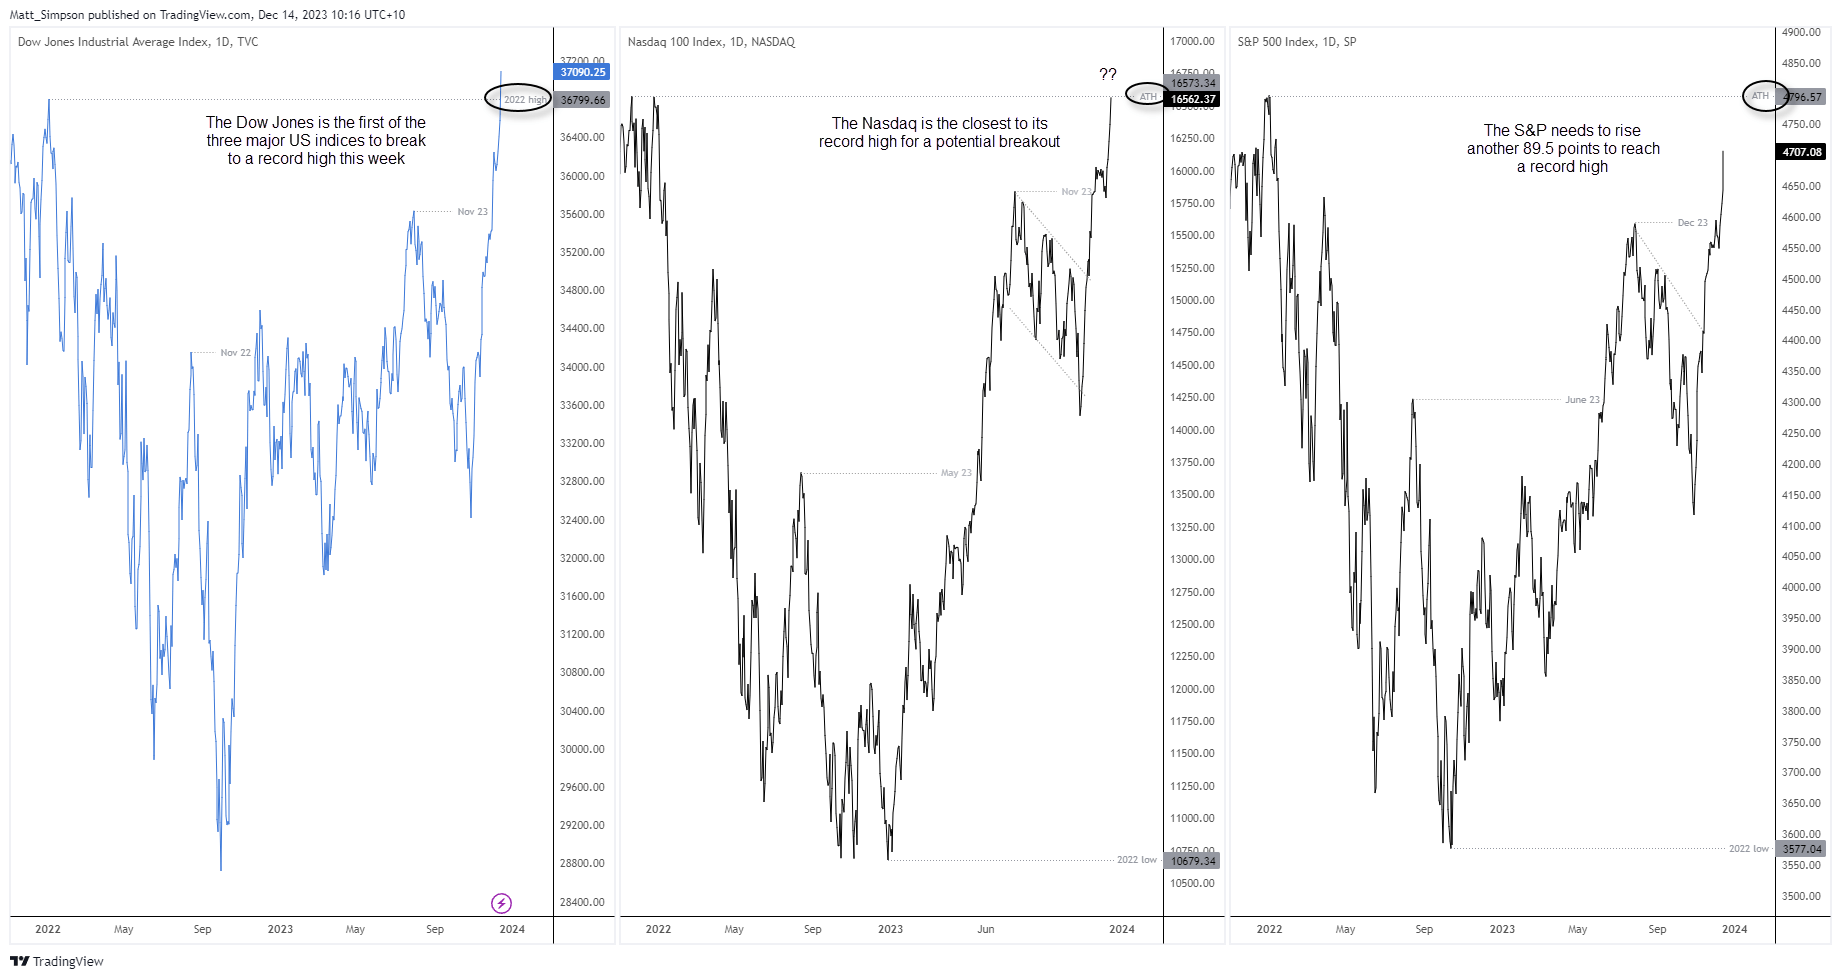
I have used daily close charts for the analysis as this is the industry standard for defining record highs or lows. Moreover, Mr Dow originally used closing charts his analysis. The chart shows that that Dow Jones has made a clear break above its record high, whilst the Nasdaq 100 closed just a cat’s whisker beneath it. The S&P 500 is clearly the clear laggard, but it only requires a 2% rally to achieve ‘record high’ status and confirm the breakout of all three indices, assuming the Nasdaq continues higher in tandem with the S&P 500.
And due to the Fed’s dovish pivot and the tendency for stocks to rally in the second half of December, I suspect the Dow’s breakout to be genuine.
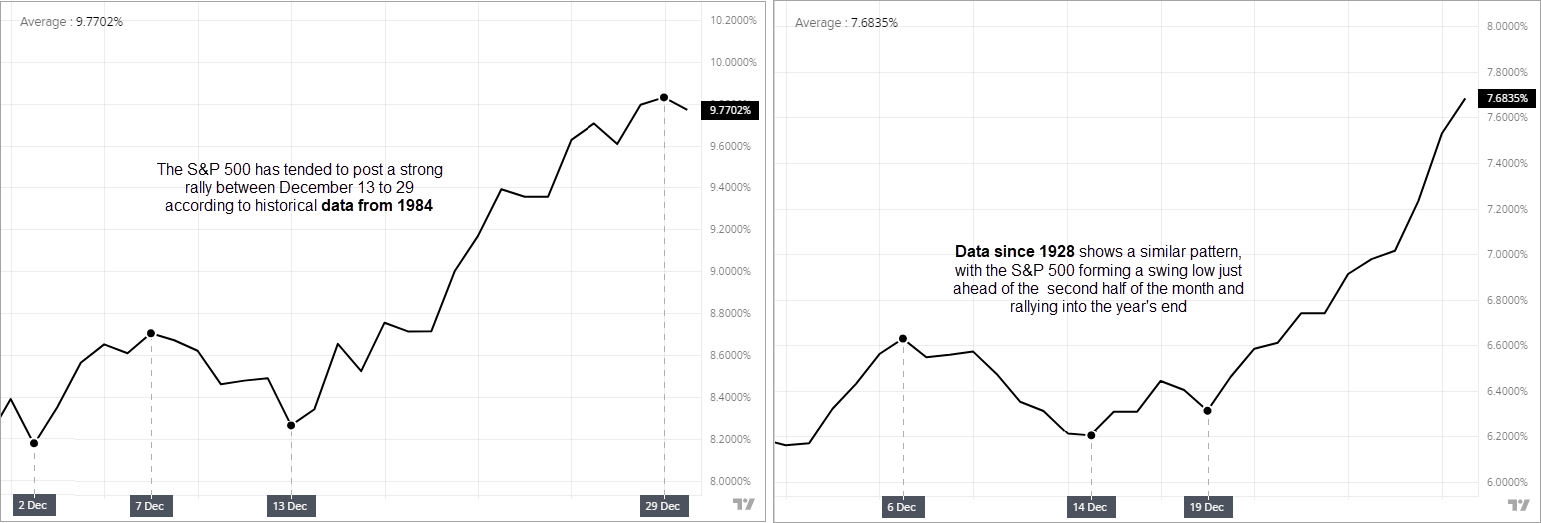
See how the S&P 500 seasonality pattern for December: S&P 500 forecast: A closer look at ‘Santa’s rally’
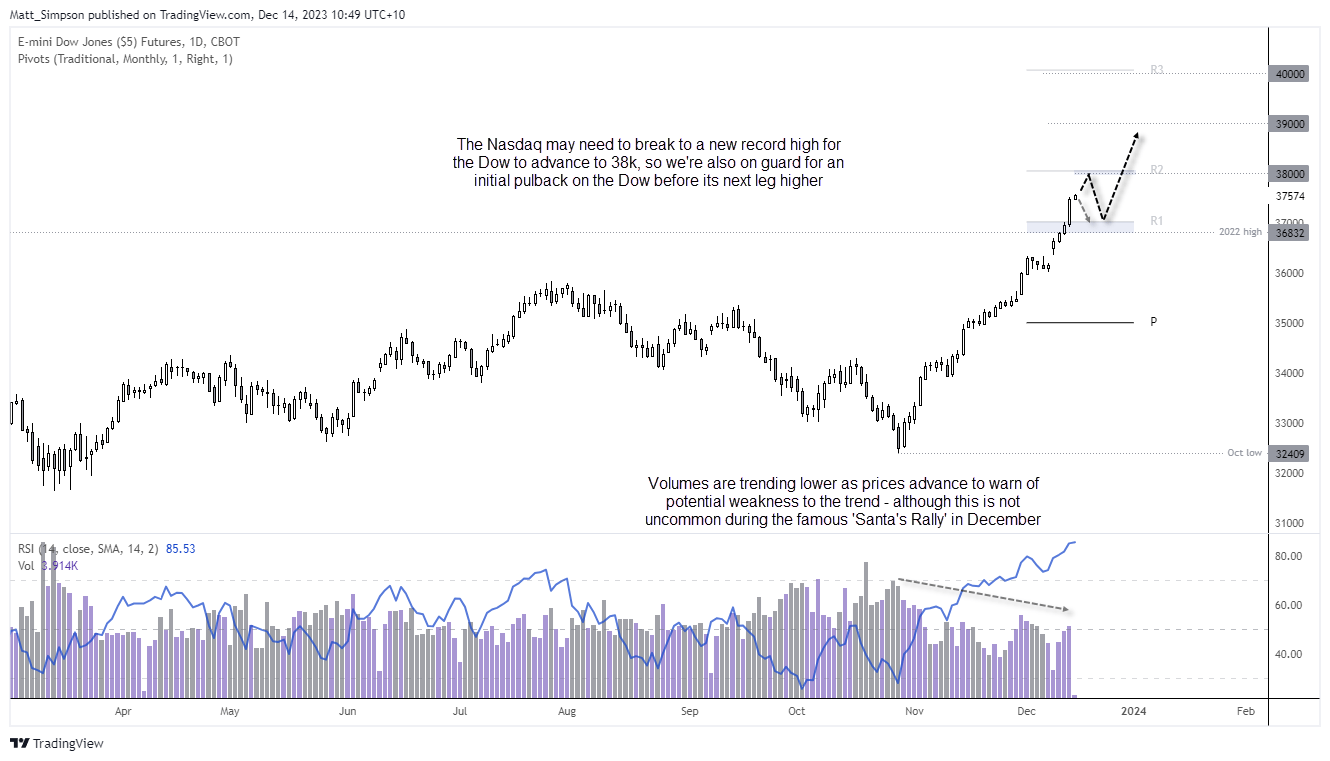
Dow Jones futures technical analysis (daily chart):
The rally from the October low has effectively been in a straight line. On one hand, we should probably expect lower returns than usual for the potential ‘Santa’s rally’, but then it is not every day we see the Fed present a dovish pivot.
Therefore, the bias is for an initial move to 38k near its monthly R2 pivot. At which point a retracement towards 37k could reignite bullish interest for at least an attempt to 39k (and dare I say Dow 40,000?). Should prices instead show signs of exhaustion below 38k, then I’d prefer to wait for a pullback towards 37k / 2022 high before reconsidering longs.
Of course, traders should keep an eye on how the Nasdaq 100 behaves around its all-time high to get a feel for timing on the Dow.
-- Written by Matt Simpson
Follow Matt on Twitter @cLeverEdge
How to trade with City Index
You can trade with City Index by following these four easy steps:
-
Open an account, or log in if you’re already a customer
• Open an account in the UK
• Open an account in Australia
• Open an account in Singapore
- Search for the market you want to trade in our award-winning platform
- Choose your position and size, and your stop and limit levels
- Place the trade
Latest market news
Yesterday 01:32 PM
Yesterday 09:35 AM
Yesterday 07:23 AM
Yesterday 04:48 AM
Yesterday 12:17 AM
July 25, 2024 10:39 PM
Latest Trade Ideas articles

Yesterday 09:35 AM

Yesterday 12:17 AM

July 25, 2024 10:39 PM

July 25, 2024 05:30 PM