


DJIA, S&P 500, Nasdaq 100 Key Points
- Today’s US data - Durable Goods Orders, Case-Shiller Home Price Index, and CB Consumer Confidence – generally met expectations
- The DJIA and SPX are seeing bullish consolidations after breaking out to a record highs last week.
- The Nasdaq 100 is testing the top of its 1-month range at record high, with a potential breakout targeting 19K.
This morning’s economic data out of the US (Durable Goods Orders, Case-Shiller Home Price Index, and CB Consumer Confidence) was generally in-line with expectations, giving little in the way of new impetus to markets in a holiday-shortened week.
With major US indices trading near flat on the day, and week so far, I wanted to take a step back and reset the bigger-picture technical view on the Dow Jones Industrial Average, S&P 500, and Nasdaq 100:

Dow Jones Technical Analysis – DJIA Daily Chart
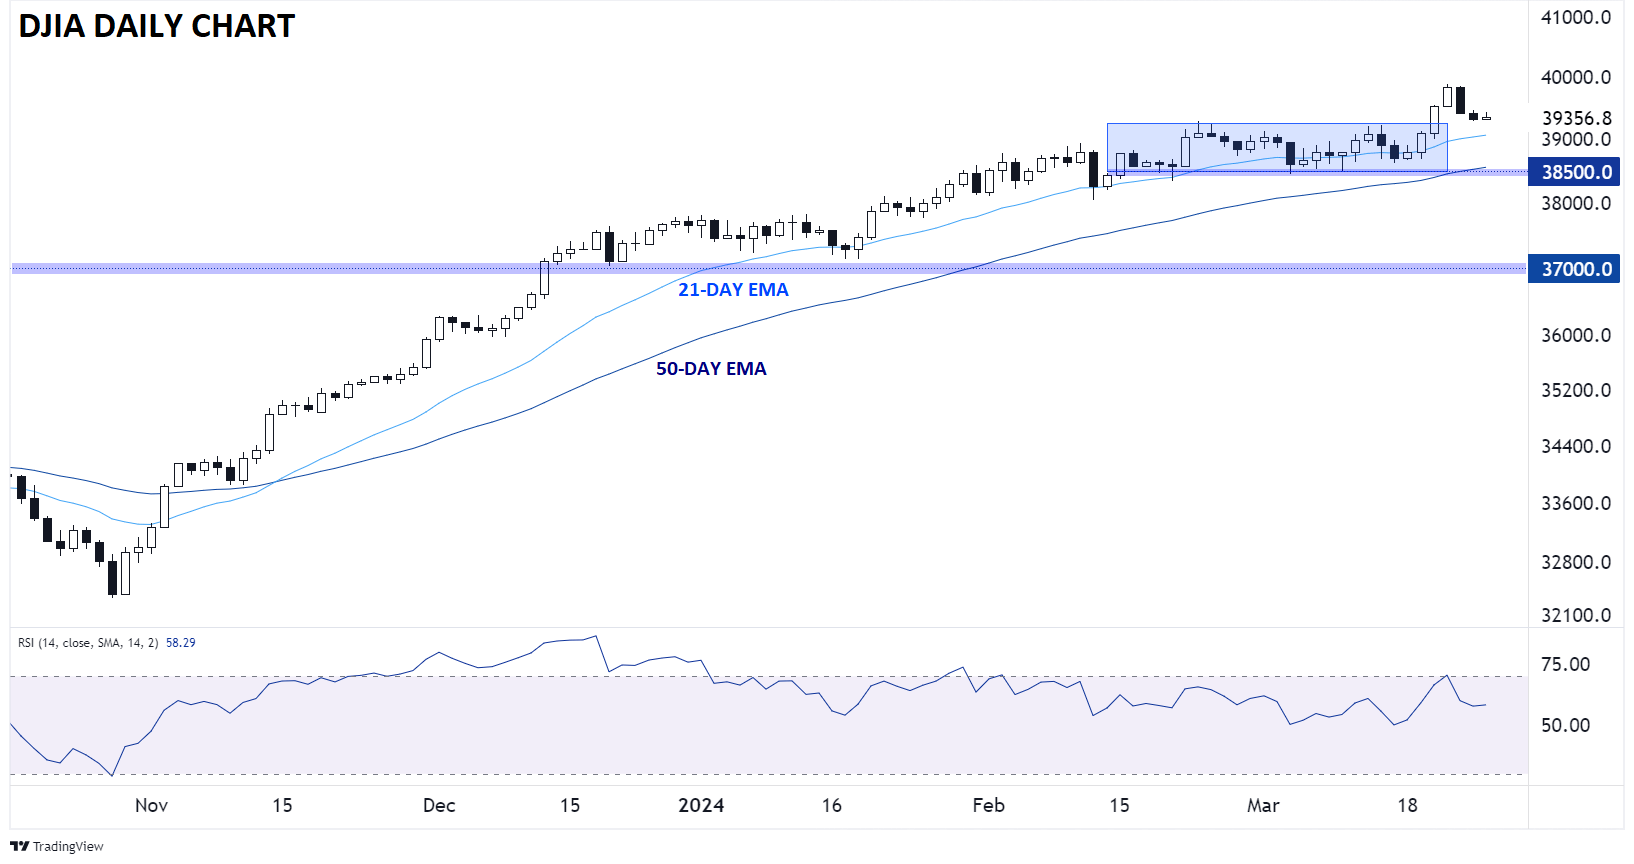
Source: TradingView, StoneX
Papa Dow provided a picture-perfect example of correcting through time, not price, from mid-February to mid-March. The prolonged consolidation near record highs in the 39K area worked off both the bearish divergence and “overbought” condition in the 14-day RSI (lower panel), setting the stage for last week’s breakout to fresh record highs near 40K.
Even despite the pullback over the last two days, the index remains in a healthy uptrend as long as price holds above the bottom of its recent consolidation range, and the 50-day EMA, near 38,500. To the topside, bulls will be stocking up on “Dow 40K” hats to throw on sooner rather than later, with blue skies above that level as long as support continues to hold.
S&P 500 Technical Analysis – SPX Daily Chart
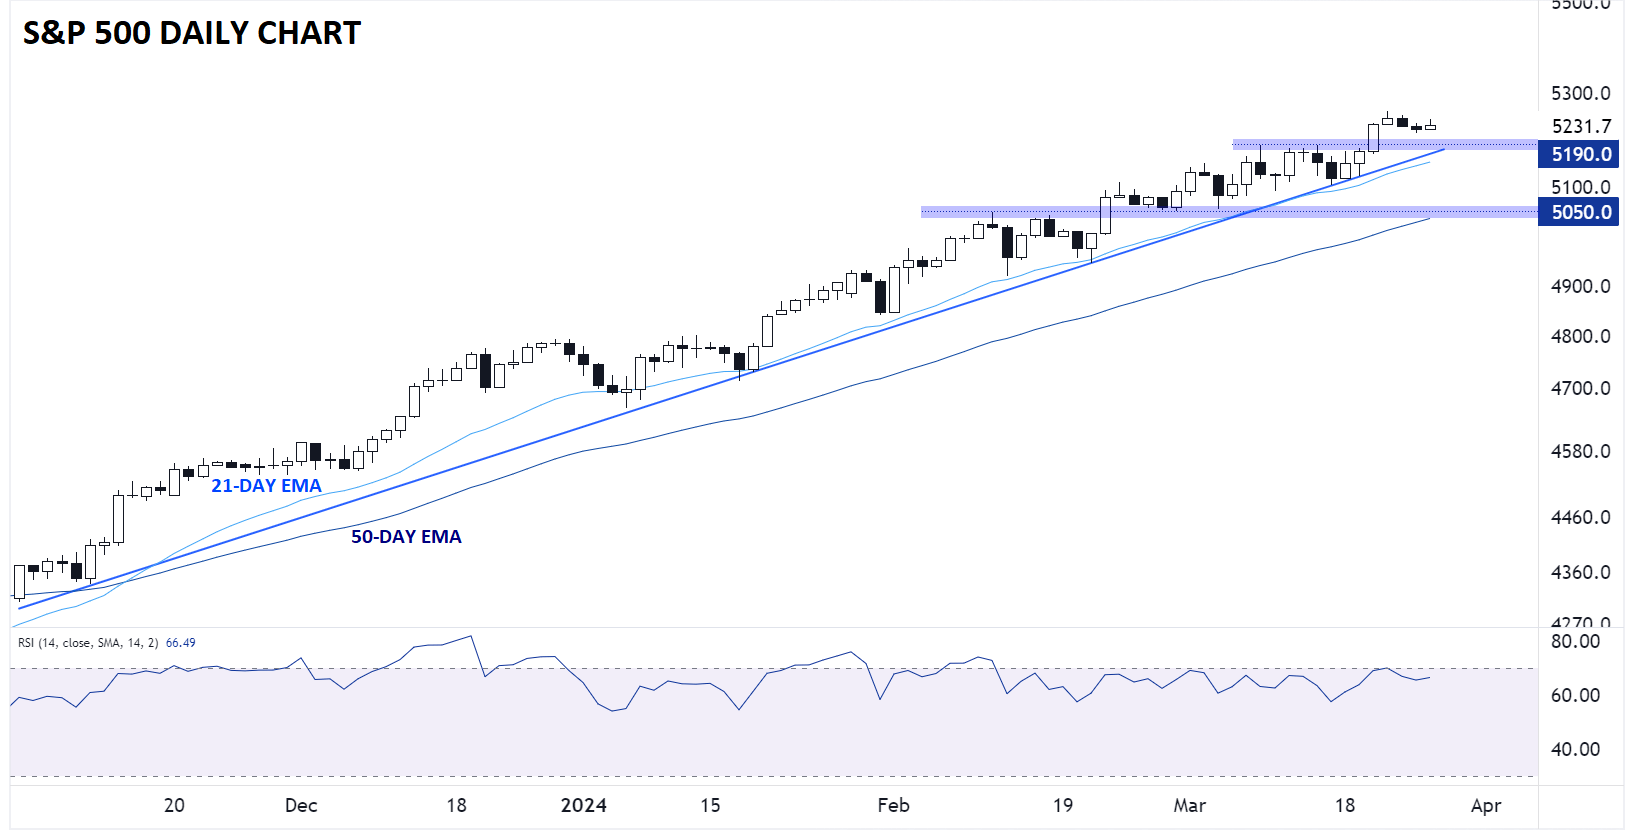
Source: TradingView, StoneX
If anything, the chart of the S&P 500 looks even more bullish than that of the Dow. The broad index of large market-cap stocks has consistently put in higher highs and higher lows since bottoming last November, without even seeing a 2% pullback on a closing basis over that period. Historically, prolonged periods without 2% dips have been bullish developments for the future, with analyst Jason Goepfert noting that the S&P 500 traded higher six months later following all seven previous 100-day streaks without a 2% pullback, with a median return of nearly 7% in those 6-month windows.
Flipping back to the pure technicals, there’s little for bulls not to like about SPX’s daily chart. Near-term support sits at the confluence of the rising trend line and previous-resistance-turned-support at 5190, and like the Dow, there are no major resistance levels to watch to the topside. Inevitably, the relentless uptrend will end at some point, but until it does, the path of least resistance remains to the topside.
Nasdaq 100 Technical Analysis – NDX Daily Chart
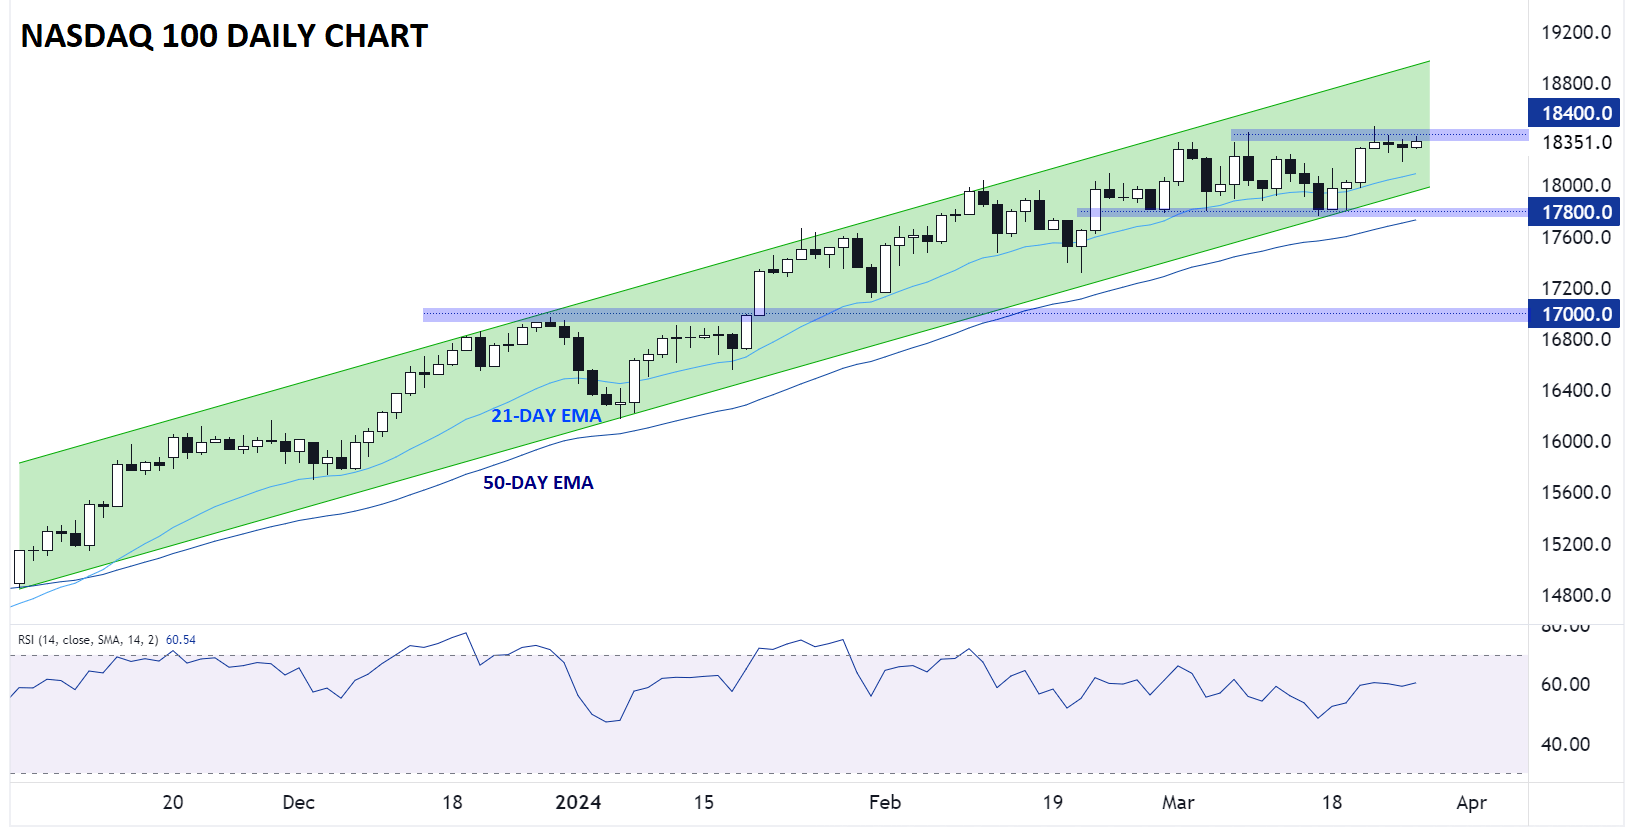
Source: TradingView, StoneX
Last but not least, the tech-heavy Nasdaq 100 has been trailing its more diversified rivals slightly over the past couple of weeks, but the broader outlook remains generally bullish. Over the last four weeks, NDX has carved out a sideways range between 17,800 and 18,400, trying to match the Dow in correcting through time, rather than through price. Over the past couple of sessions, the index has consolidated in very quiet trade just below the top of that range, potentially setting the stage for a major breakout to fresh record highs.
As long as the index holds above 17,800 support, bulls will be watching for a breakout, with the range’s “measured move” projection and the top of the channel both hinting at a potential rally toward 19K if we clear 18,400 resistance.
-- Written by Matt Weller, Global Head of Research
Follow Matt on Twitter: @MWellerFX
Latest market news
Yesterday 01:32 PM
Yesterday 09:35 AM
Yesterday 07:23 AM
Yesterday 04:48 AM
Yesterday 12:17 AM
July 25, 2024 10:39 PM
Latest Indices articles

July 25, 2024 01:30 PM

July 25, 2024 01:01 AM

July 25, 2024 12:41 AM

July 24, 2024 07:26 PM