


The combination of a weaker yuan and tighter COVID restrictions being announced across several large cities weighed on the Hang Seng yesterday, although the Shanghai Composite Index rose 0.4% thanks to a rise in oil prices.
A private survey revealed that Services PMI expanded at a relatively healthy rate of 55, although down slightly from 55.5 the previous month. The expansion was driven by a “solid rise in overall sales” according to the Caixin China General Services PMI, and international demand remained subdued with foreign sales falling in August.
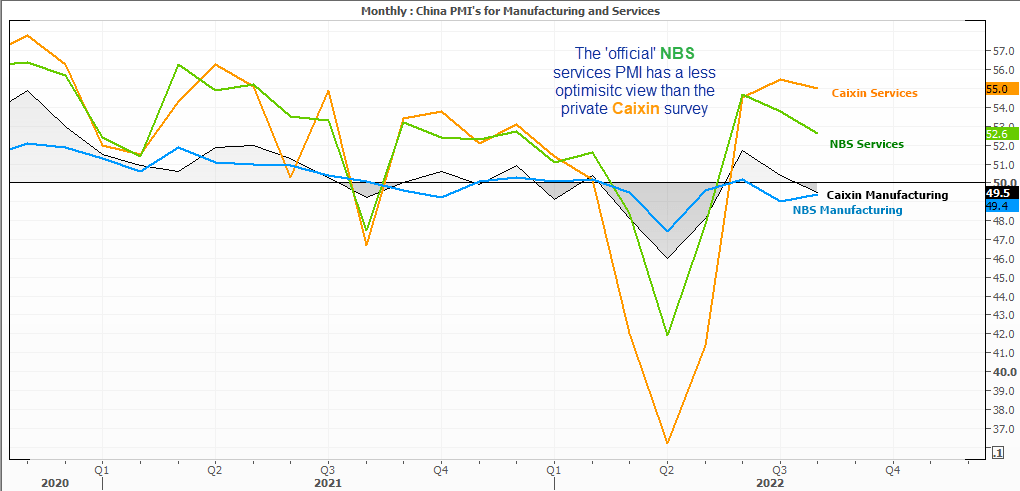
It’s interest to see a slight divergence between the ‘official’ NBS services PMI – which fell to 52.6 – whilst the Caixin sits at 55. Traditionally the NBS surveys have been the more optimistic of the two. But the private and official surveys agree that the manufacturing sector is contracting. Either way, growth targets have been lowered by several major banks this past week with some of the lower estimates sitting ~3% for China’s 2022 growth.
Despite new stimulus packages unveiled by the government and further easing from the PBOC (People’s Bank of China), critics hold the view it is not enough to support growth. This has seen Chinese equities remain under pressure overall, alongside global equites which face fears of a recession. But as markets do not move in straight lines it provides opportunities for countertrend traders along the way, and price action on the Hang Seng Index (HSI) has caught our eye.
Hang Seng daily chart:
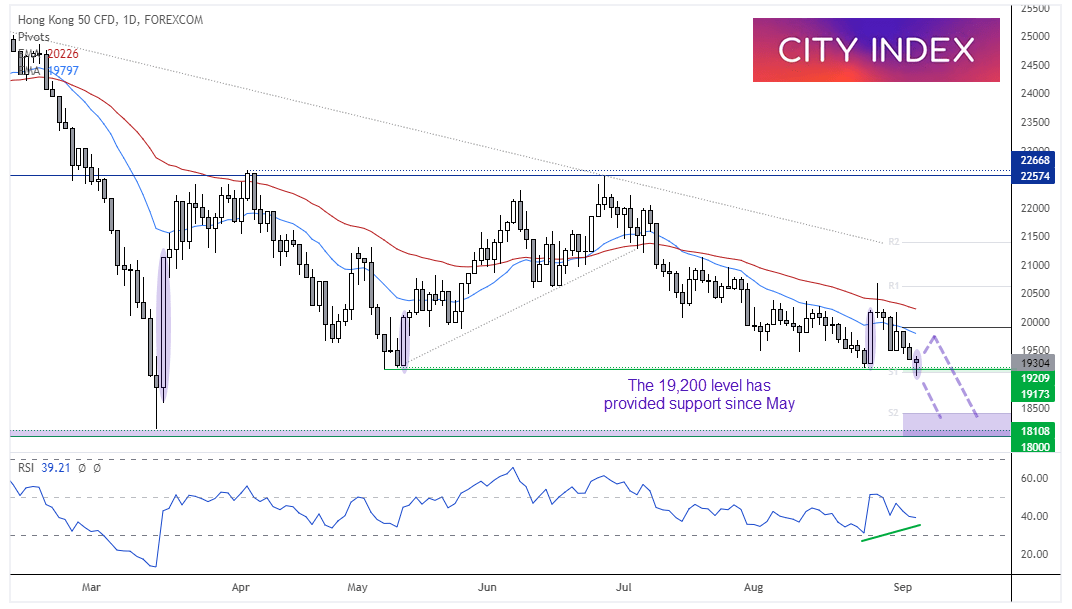
Despite its downtrend on the daily chart, the HSI produced a strong bullish engulfing candle on the 25th of August which showed strong demand around 19,200 – a level which has held since May (and a similar candle occurred). Whilst it printed a bearish pinbar and then fell back below 20,000, the fact it took 6 days to unwind the gains of the engulfing candle can be seen as a form of strength.
Also note that we saw a false break of the 19,200 support area yesterday despite the negative sentiment, and the day closed with a bullish hammer. Furthermore, the hammer formed and closed above key support and the weekly S1 pivot point, and a bullish divergence formed on the RSI.
The near-term bias remains bullish above yesterday’s low and for a move back to the 20-bar eMA, or weekly pivot point. Whereas a break beneath yesterday’s low (or daily close) assumes its next leg lower has begun and brings the 18,400 region into focus.
How to trade with City Index
You can easily trade with City Index by using these four easy steps:
-
Open an account, or log in if you’re already a customer
• Open an account in the UK
• Open an account in Australia
• Open an account in Singapore
- Search for the company you want to trade in our award-winning platform
- Choose your position and size, and your stop and limit levels
- Place the trade
Latest market news
Yesterday 01:32 PM
Yesterday 09:35 AM
Yesterday 07:23 AM
Yesterday 04:48 AM
Yesterday 12:17 AM
July 25, 2024 10:39 PM
Latest Trade Ideas articles

Yesterday 09:35 AM

Yesterday 12:17 AM

July 25, 2024 10:39 PM

July 25, 2024 05:30 PM