


In an environment of heightened risk aversion, sluggish global economic growth and interest rates that are ratcheting higher, a volatile monthly inflation indicator from Australia doesn’t scream as overly important in the broader scheme of things. So that’s exactly how the August report from Australia’s Bureau of Statistics (ABS) should be treated when released later Wednesday, providing traders an opportunity to fade any knee-jerk movement on the data.
Soaring fuel prices expected to boost headline inflation
As has been seen in other developed nations around the world, headline inflation has been easing in Australia on a year-on-year basis since December, decelerating from 8.4% to 5.4% in July.
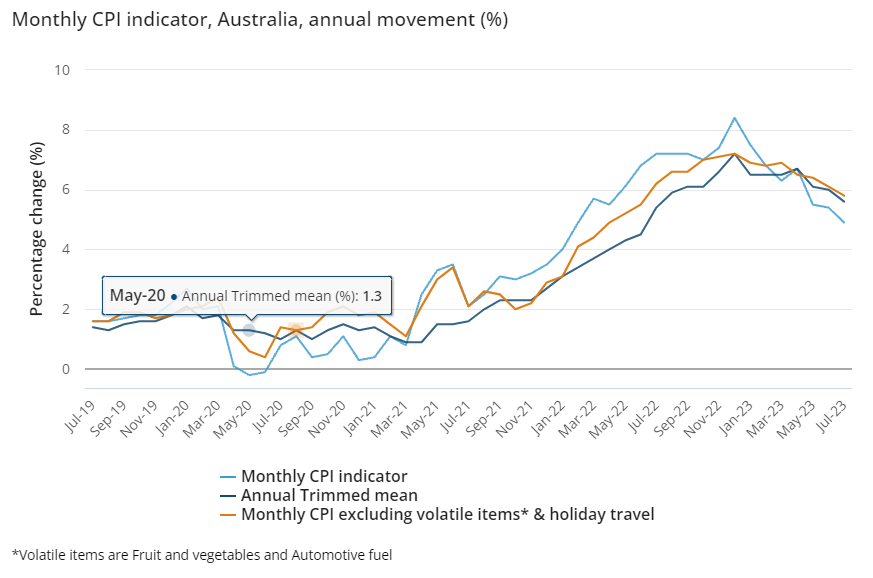
Source: ABS
However, on the back of a 9% lift in fuel prices during the month, the median economist forecast looks for the annual rate to pickup to 5.2%. Given the effect of the weaker Australian dollar both against the greenback and other major trading partners on trade prices, there’s a risk the headline rate may even come in hotter-than-expected. There’s also plenty of uncertainty as to how government energy rebates to some households will influence the result, making it a bit of a dog’s breakfast to interpret. So, save yourself the trouble.
Fade AUD/USD moves on headline CPI, focus on underlying measures
Regardless of what happens with the headline, it shouldn’t really feature in the discussion about what it will mean for the RBA and the outlook for Australia’s cash rate. The RBA, like other central banks, is far more interested in underlying inflation trends, meaning the ‘CPI excluding volatile items and holiday travel’ is the reading you should really be watching. It too has been decelerating on a year-on-year basis, slowing to 5.8% in July. Unless we see a pickup in that rate – something that appears unlikely given a 0.7% monthly increase from August last year will generate a high basis effect – it will only add to evidence inflation is slowly returning towards the top of the RBA’s 2-3% target.
Trading AUD/USD around the inflation indicator
While the report should be faded in the absence of a large upside or downside surprise in the ex-volatile items reading, markets starved of fresh inflation data are unlikely to see it that way, at least initially. I expect there’ll be a reaction, the real question is what do when it come?
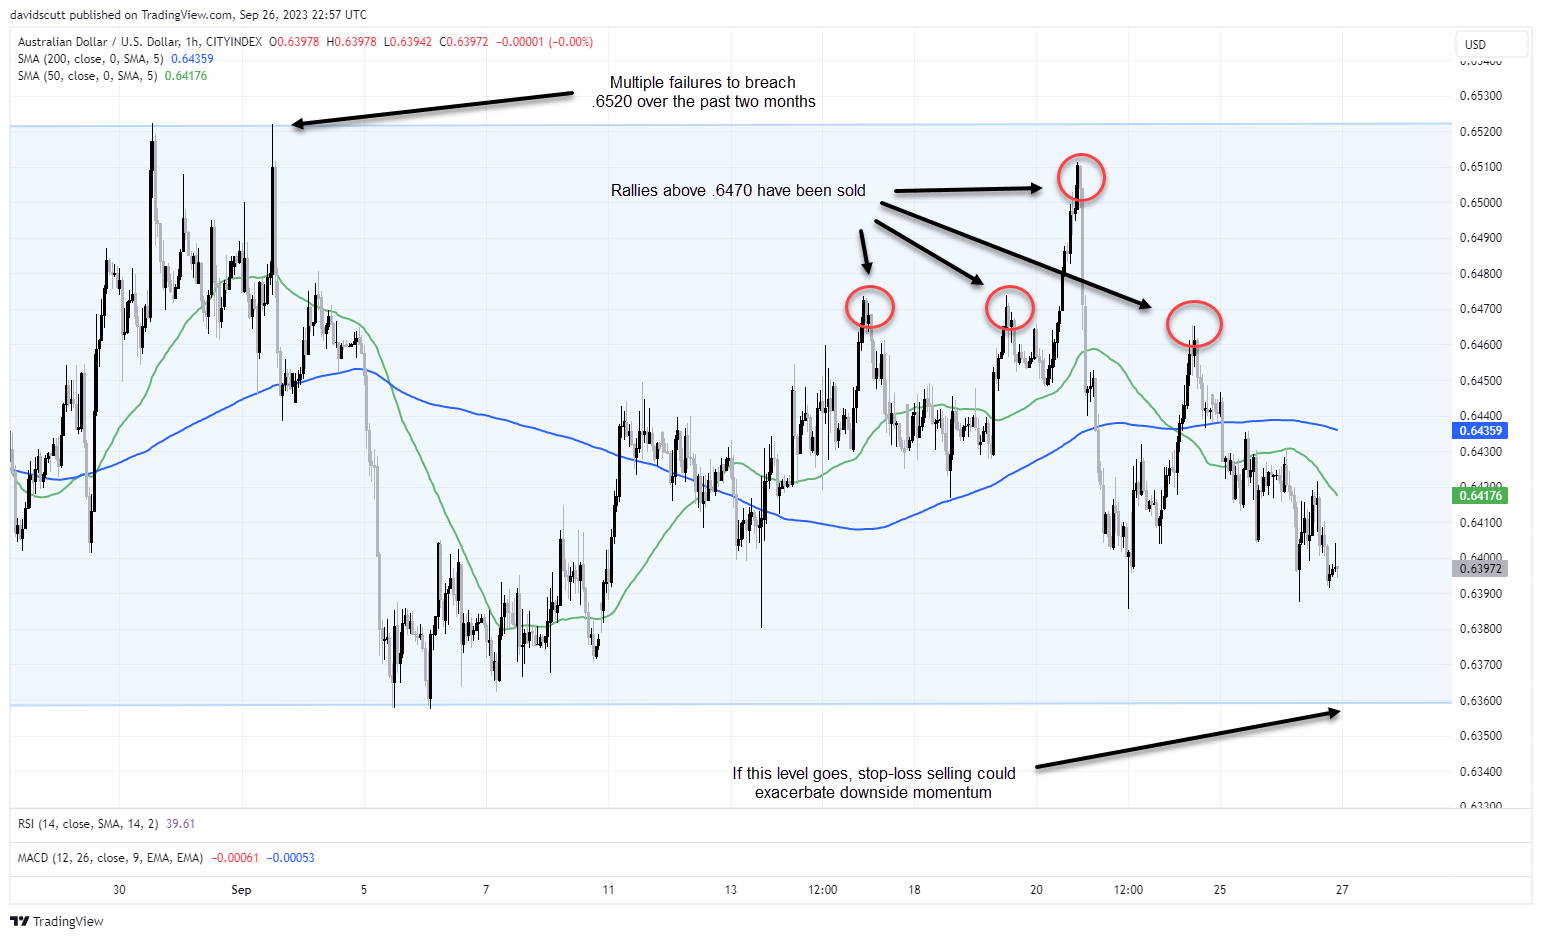
Looking at the hourly chart, it’s been a largely uneventful September so far for AUD/USD trading in a relatively narrow range around multi-year lows as part of a broader downtrend. For anyone trading around the data, the pair’s inability to break convincingly above .6500 in recent months makes pops towards the upper end of the range provides a decent entry level for short positions with a stop located above .6520. Under a scenario where underlying inflation is weak, a retest of the range low appears likely given current macro headwinds. Should that level fail, it will likely trigger stops below in quick fashion, opening up the potential for AUD/USD to push back towards .6300 and beyond.
-- Written by David Scutt
Follow David on Twitter @scutty
How to trade with City Index
You can trade with City Index by following these four easy steps:
-
Open an account, or log in if you’re already a customer
• Open an account in the UK
• Open an account in Australia
• Open an account in Singapore
- Search for the market you want to trade in our award-winning platform
- Choose your position and size, and your stop and limit levels
- Place the trade
Latest market news
Today 05:56 AM
Yesterday 11:57 PM
Yesterday 08:00 PM
Yesterday 02:00 PM
Latest AUD/USD articles


April 24, 2024 02:03 AM

April 22, 2024 10:40 PM

April 18, 2024 02:40 AM