


It can be beneficial to stand back to admire a view from time to time, but in the case of the ASX 200 I would highly recommend it. We can see that the ASX has repeatedly failed to test 7700 since it reached a record high in August 2021, let along break above it. And each failed attempt to do so has resulted in double-digit declines in percentage terms.

A combination of factors propelled global indices higher at the end of 2023. Of course, we had the usual Santa’s rally which tends to benefit from portfolio ‘window dressing’, but markets were also pricing in multiple rate cuts for the Fed which supported Wall Street (and all else followed). The risks of regional warfare for the Middle East has largely been ignored, but what if that changes? As for multiple cuts, a stronger US economy means that rates will remain higher for longer than current market pricing suggests. And of the wheels of the global economy fall off, you’d think indices would have to begin pricing in a hard landing and roll over from cycle highs.
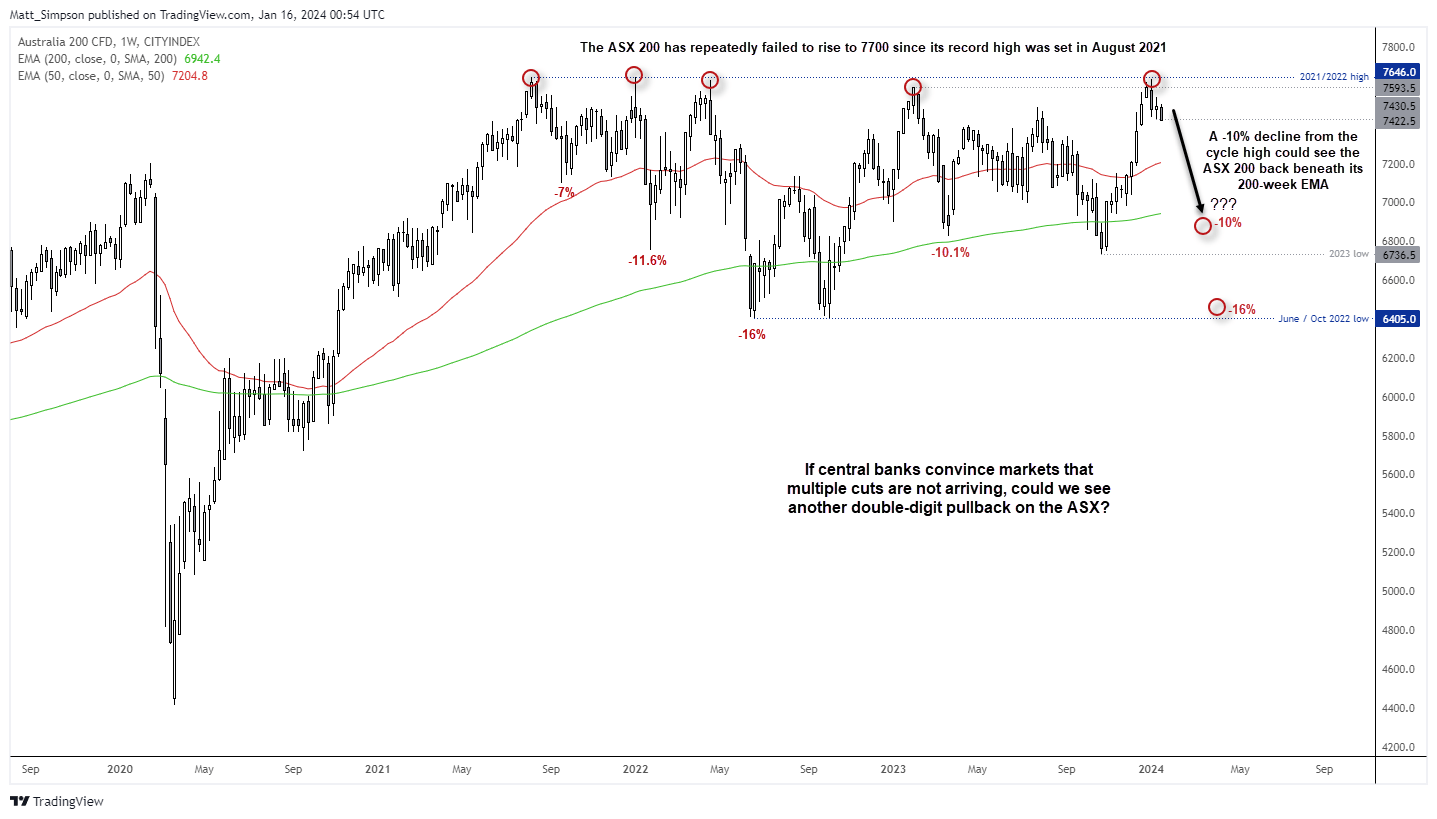
ASX 200 technical analysis (weekly chart):
The ASX 200 weekly chart shows that three of the four declines from the cycle highs have been double digits in percentage terms. If the ASX Is to fall by -10% from the current cycle high, it will find itself trading beneath the 7,000 handle and the 200-week EMA.
On that note I find it interesting that the market has spent a few weeks beneath the 200-week EMA before rebounding sharply, but that is something to consider if we do see a sharp move lower. And if we’re to see another -16% drop the ASX will find itself back near the June and October 2022 lows around 6400.
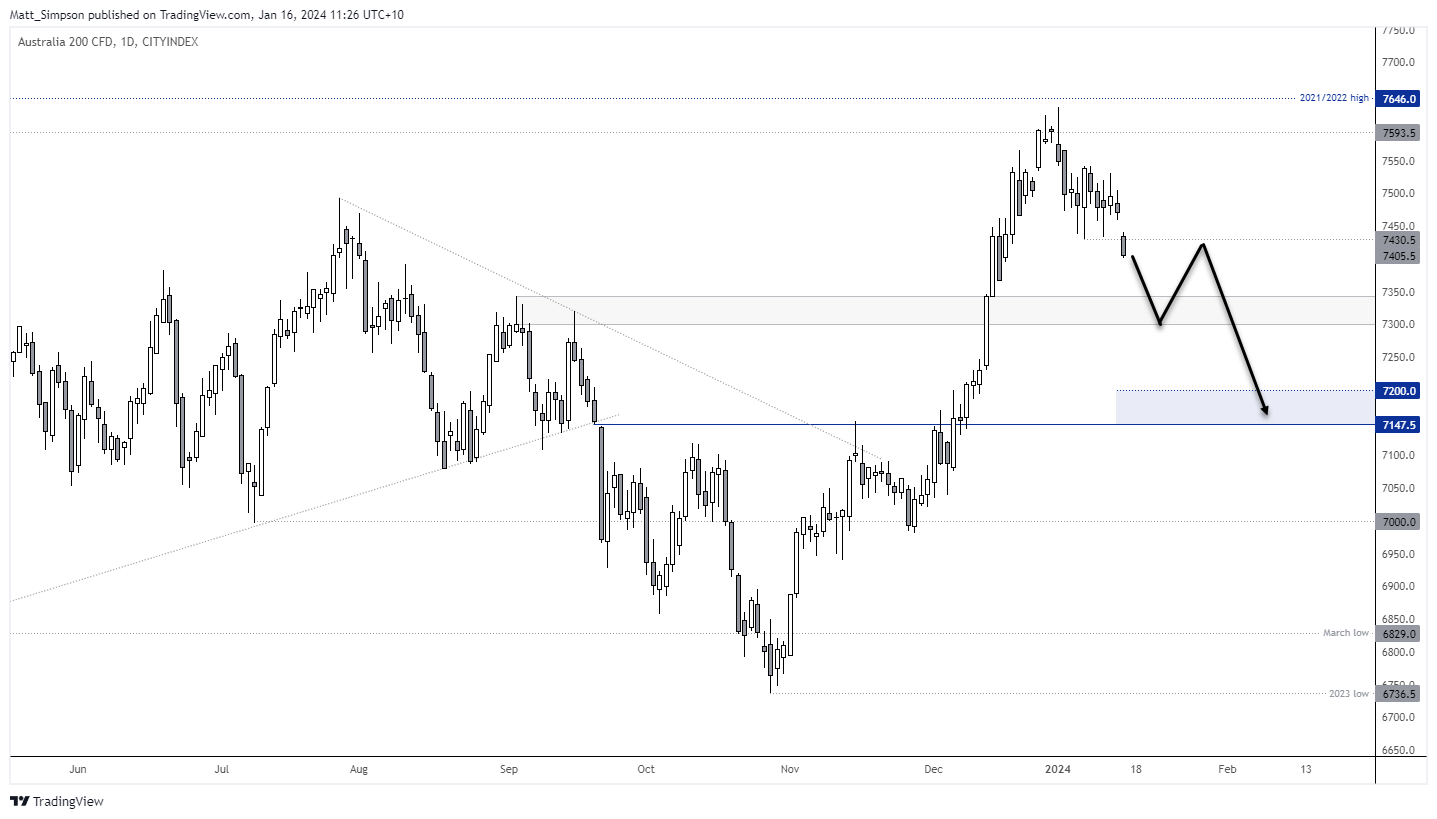
ASX 200 technical analysis (daily chart):
As bearish as the weekly chart may appear, it must be said that the trend structure on the daily does seem bullish overall. However, the ASX has fallen beneath last week’s low and AUD/USD has broken a key support area in what could be described as a mild risk-off session in Asia. Of course, to achieve 10% or more declines we’ll likely need to see wheels fall off of sentiment for global indices.
For now, a move to the 7300 – 7346 zone seems feasible whilst prices remain below 7500, a break beneath which brings 7200 and 7150 into focus for bears.
-- Written by Matt Simpson
Follow Matt on Twitter @cLeverEdge
How to trade with City Index
You can trade with City Index by following these four easy steps:
-
Open an account, or log in if you’re already a customer
• Open an account in the UK
• Open an account in Australia
• Open an account in Singapore
- Search for the market you want to trade in our award-winning platform
- Choose your position and size, and your stop and limit levels
- Place the trade
Latest market news
Yesterday 01:32 PM
Yesterday 09:35 AM
Yesterday 07:23 AM
Yesterday 04:48 AM
Yesterday 12:17 AM
July 25, 2024 10:39 PM
Latest Trade Ideas articles

Yesterday 09:35 AM

Yesterday 12:17 AM

July 25, 2024 10:39 PM

July 25, 2024 05:30 PM