


The US dollar index suffered its worst week of the year last week, on renewed bets of a Fed June cut. Jerome Powell’s mention of the word ‘cut’ during his testimony to the House Committee lit bearish USD bets on fire ahead of this week’s inflation report. Yet Tuesday’s inflation print may have thrown a spanner in the works, with the two headline CPIs rising 0.4% m/m in February and core CPI still nearly twice the Fed’s 2% target.
To me, this suggests June is too early for a Fed cut. Yet the market reaction was one of confusion and clear disagreement.
- Wall Street rallied and trades just off its record high (although Oracle share’s price also played a hand)
- Whilst the US dollar rebounded for a second day – it handed back most of its post-CPI gains.
- EUR/USD, AUD/USD, USD/CHF and USD/CAD effectively closed flat, it suggests FX traders are taking the higher inflation report within their stride. And that places them in a good position to extend their gains should incoming US data come in soft.
- Fed fund futures still imply a 57% chance of a June cut
- US yields rose for a second day, which I suspect provides the more accurate picture; a June cut is less likely

With traders in disagreement about what this week’s US inflation report mean, it will be down to incoming data to shape expectations ahead of the Fed’s meeting next week. Whilst a hold is a given, that next meeting can shape expectations for if or when the Fed may cut, given it includes updated economic forecasts and of course the closely-watched dot plot.
We also have the BOJ meeting next week where it remains finely balanced whether they will hike rate or not. And news has just hit the wires the large firms in Japan have agreed to the full terms of wage rises from unions, which likely bolsters the case for a hike. Still, given the fall in USD/JPY last week in anticipation of a hike, it remains plausible USD/JPY could hold its ground heading into next weeks events.
US calendar events ahead of the Fed meeting:
|
Date |
GMT |
Event |
|
Thursday, March 11 |
12:30 |
Producer prices, jobless claims, retail sales |
|
- |
14:00 |
Business inventories, retail inventories |
|
Friday, March 15 |
12:30 |
NY Empire State Manufacturing, Import price index |
|
|
13:45 |
Industrial production, manufacturing production |
|
|
14:00 |
Michigan consumer sentiment and inflation expectations |
|
Monday, March 18 |
14:00 |
NAHB Housing Market Index |
|
Tuesday, March 19 |
12:30 |
Building permits, housing starts |
|
Wednesday, March 20 |
18:00 |
Fed interest rate decision, statement, forecasts |
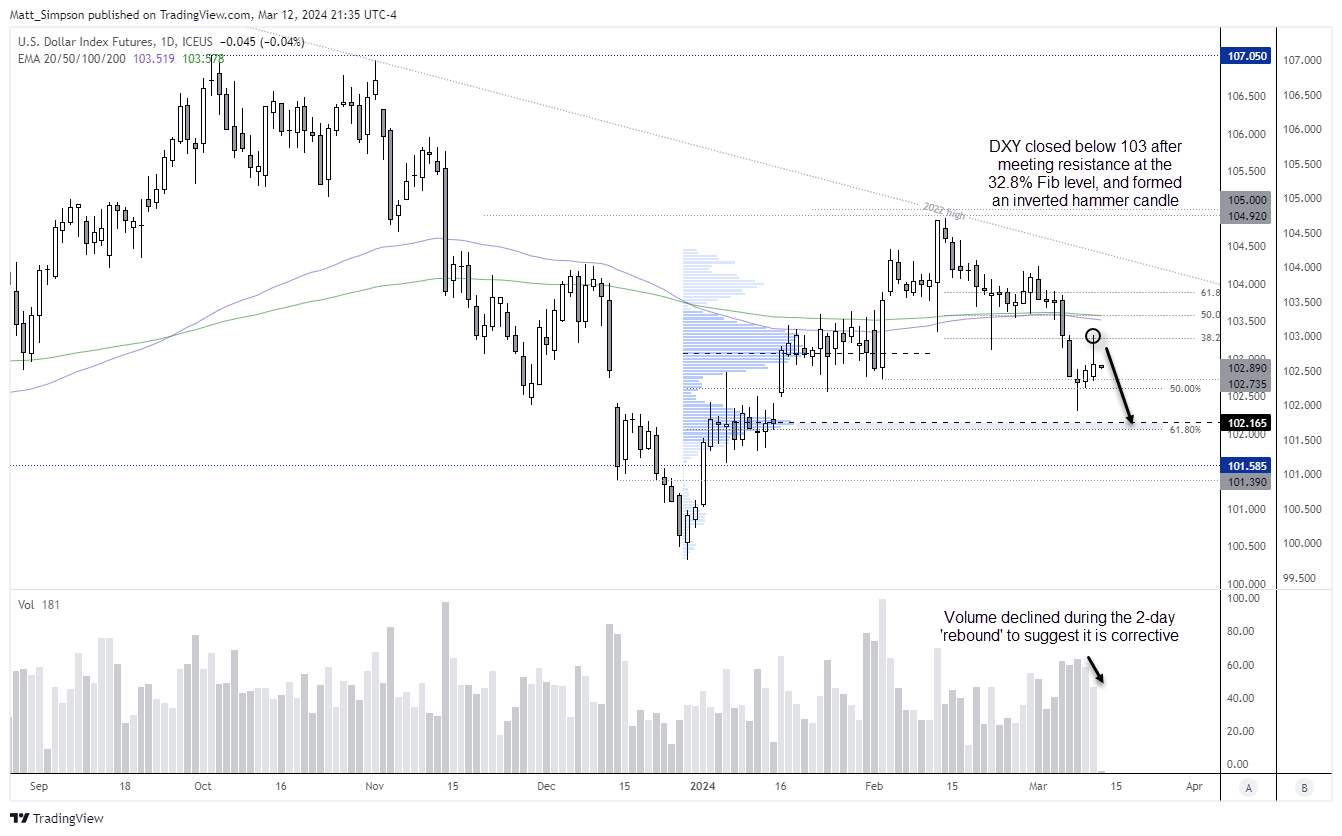
US dollar index technical analysis:
Technically the US dollar rose for a second day, but the fact it failed to hold above 103 makes its 2-day 'rebound' less than impressive. The upper wick of Tuesday’s inverted hammer respected the 38.2% Fibonacci ratio as resistance, and daily trading volumes of the prior two days has diminished whilst prices rose, which suggests the move higher is simply a retracement of its next leg lower.
Of course, to send the US dollar materially lower will likely require incoming data be below expectations. But even form a technical standpoint, the bias is to fade into minor rallies and target the high-volume node and 61.8% Fibonacci level, just above the 102 handle.
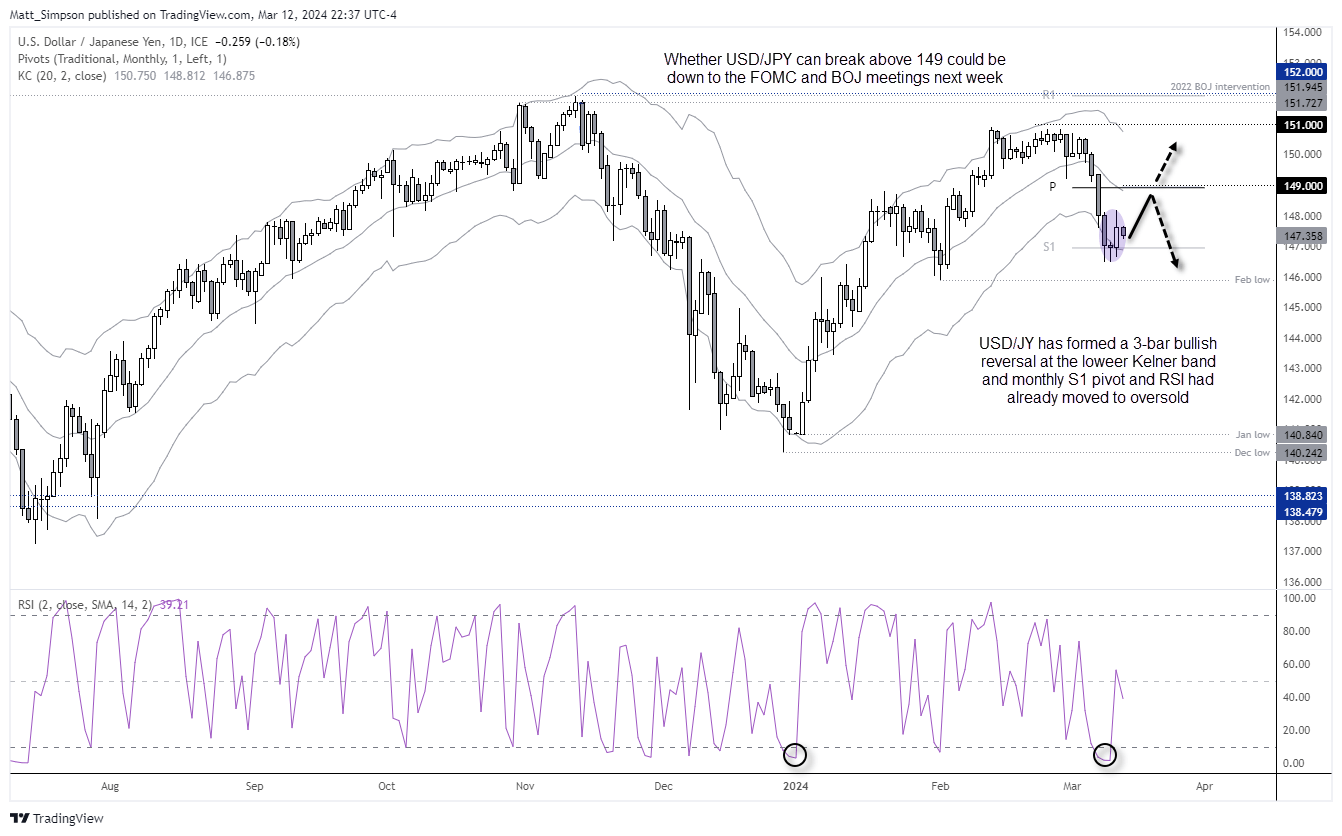
USD/JPY technical analysis:
USD/JPY snapped a 5-day losing streak on Tuesday, which was also its worst five days in three months. And as it saw two daily closes outside the lower Keltner band, yesterday’s bullish candle suggests the mean reversion higher I called for on Friday is finally underway.
The daily chart also closed above the monthly S1 pivot point, and a 3-bar bullish reversal pattern (morning star) formed around the lower Keltner band – after RSI (2) reached oversold.
Prices are already retracing within Tuesday’s range in today’s Asia session, and that could help bulls enter longs at a more favourable price with a stop either beneath Friday’s low (or beneath the H4 bullish engulfing candle at 149.62 for tighter risk management).
Assuming this is classic mean reversion of a Keltner band, bulls could target the 20-day MA around the 149 handle.
-- Written by Matt Simpson
Follow Matt on Twitter @cLeverEdge
How to trade with City Index
You can trade with City Index by following these four easy steps:
-
Open an account, or log in if you’re already a customer
• Open an account in the UK
• Open an account in Australia
• Open an account in Singapore
- Search for the market you want to trade in our award-winning platform
- Choose your position and size, and your stop and limit levels
- Place the trade
Latest market news
Yesterday 01:32 PM
Yesterday 09:35 AM
Yesterday 07:23 AM
Yesterday 04:48 AM
Yesterday 12:17 AM
July 25, 2024 10:39 PM
Latest Trade Ideas articles

Yesterday 09:35 AM

Yesterday 12:17 AM

July 25, 2024 10:39 PM

July 25, 2024 05:30 PM