


…But the trend remained bullish ahead of key earnings and central bank meetings
US indices struggled to shake off the early weakness as European markets closed for the day. However, “profit-taking” was written all over the markets, rather than anything significant. For, there was no major catalysts behind today’s sell-off. Indeed, the selling pressure was relatively mild, and the major indices holding within recent ranges at the time of writing. So, despite the weakness, I wouldn’t rule out the possibility for a late day rally, like we have seen on numerous occasions in recent weeks.
With investors keeping a close eye on the big macro events taking place later this week, as well as the key technology earnings results, traders were keen to figure out whether key support levels would hold as the major indices tested some interesting technical levels.
The tech-heavy Nasdaq 100 had sold off the most, down as much as 1.8% earlier. But it remained to be seen whether the weakness would turn into a proper sell-off as the index tested key support and the 200-day average around 11920 area. A bounce here would confirm the bulls are in control, which may then inspire a breakout above the December high of 12215.
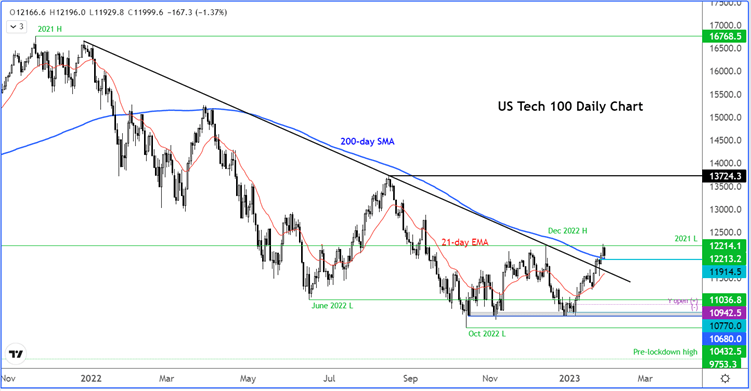
However, a daily close back below the 200-day would be a sign of weakness. Even so, we would still have to see a bit more of confirmation before declaring the bull trend is over. For now, we are giving the bulls the benefit of the doubt.
The Nasdaq will be in focus as we will have the latest earnings results from Apple, Amazon, Google owner Alphabet, and Facebook parent company Meta, among others.
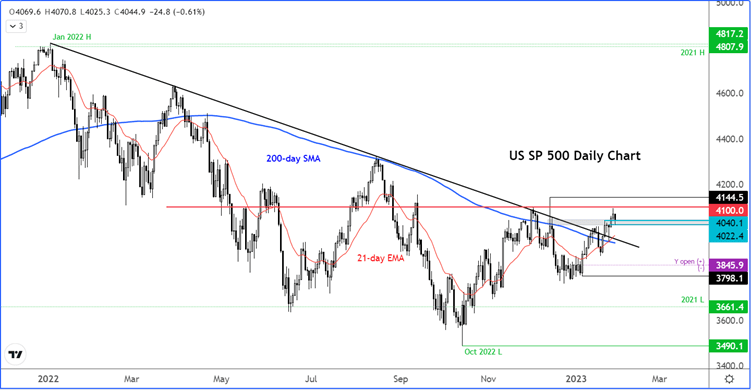
Meanwhile the S&P was showing similar price action to the Nasdaq, but it too was trying to bounce off key support around 4022. This is where the index had found resistance earlier last week, before rallying in the latter half of the week.
But with the long-term bearish trend line broken and the 200-day average reclaimed, the bulls would remain happy for as long as the S&P doesn’t now create a new lower low beneath that 200-day average again.
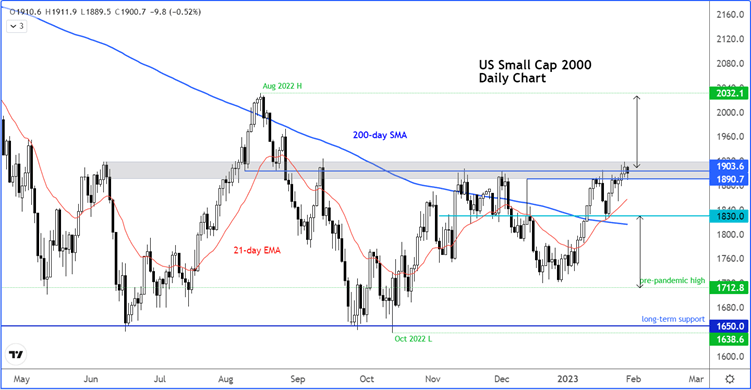
The Russell looked the most interesting one to me as the bulls try to establish their control by causing a breakout above key resistance area circa 1900. So far, they have been unable to do so, but the way the index has been creeping higher of later, it wouldn’t surprise. Importantly, a breakout above 1900 would invalidate the bearish head and shoulders pattern, which in itself would be another bullish development.
So, despite today’s weakness, the technical picture is still looing constructive for the major indices. It is all about those central bank meetings and key tech earnings. For as long as the earnings are not too bad and/or the Fed and ECB are not too hawkish, that should keep the bulls happy.
How to trade with City Index
You can trade with City Index by following these four easy steps:
-
Open an account, or log in if you’re already a customer
• Open an account in the UK
• Open an account in Australia
• Open an account in Singapore
- Search for the company you want to trade in our award-winning platform
- Choose your position and size, and your stop and limit levels
- Place the trade
Latest market news
Yesterday 01:32 PM
Yesterday 09:35 AM
Yesterday 07:23 AM
Yesterday 04:48 AM
Yesterday 12:17 AM
July 25, 2024 10:39 PM
Latest Indices articles

July 25, 2024 01:30 PM

July 25, 2024 01:01 AM

July 25, 2024 12:41 AM

July 24, 2024 07:26 PM