


EUR/USD rises from 1.05 ahead of German CPI & US GDP data
EURUSD is trading lower for a sixth straight session on Thursday.
The euro is weighed down by fears over energy security in the bloc after Russia’s state-owned Gazprom halted gas supplies to Poland and Bulgaria amid Putin’s demands for gas t be paid for in rubles.
EC President Ursula von de Leynes has warned firms that they should not give in to such demands meaning that other countries such as Germany could also see gas supplies cut.
Energy prices have jumped on the news, raising the prospect of higher inflation and a cost-of-living economic slowdown.
German inflation data is due today and is expected to show inflation was a record 7.6% in March.
Eurozone consumer confidence data is also due and is expected to remain depressed at -16.9.
Meanwhile, the US dollar index rose to a five-year high on safe-haven flows and hawkish Fed bets.
US GDP data is due later and is expected to show growth of 1% annualized. This is down from 6.9%. Stronger than forecast growth could lift the USD higher.
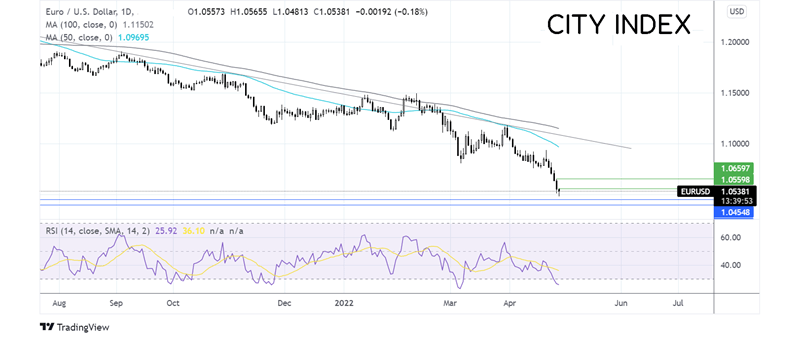
Where next for EUR/USD?
EURUSD fell to a low of 1.05; the pair trades below its 50 & 100 sma in a bearish chart. However, the daily and weekly charts show overbought conditions, which means that traders should warrant caution before placing aggressively bearish bets.
Sellers would look for a break below the 1.05 level is needed to make the part vulnerable to further declines towards 1.0450 ahead of round number 1.04 and the 2017 low of 1.0340.
On the upside, 1.0550 could offer some resistance ahead of 1.06. Buyers would need to push back over 1.0650
Barclays rises despite suspending share buyback
Barclays is rising afer releasing Q1 results. The bank beat expectations reporting net profits £1.4 billion above forecasts £644 million, which marks an 18% decline from Q1 2021.
Group income rose 10% YoY to £6.5 billion boosted by strong a strong performance in the Global Markets business thanks to a spike in volatility and boosted by higher interest rates as the BoE raised rates across the past three meetings and the Fed raised rates in March.
However, the bank is suspending its share buyback programme after an expensive trading error in the US which saw it sell $15.2 billion more in US investment products than it was allowed to. The bank has set aside £540 million as a provision to deal with the issue, which regulators on both side of the Atlantic are investigating.
Total operating expenses increased to £4.11 billion, up from £3.58 billion as a result of litigation following the trading error.
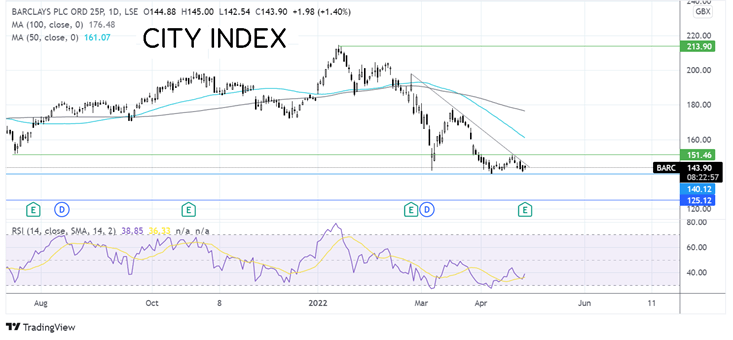
Where next for Barclays share price?
Barclays trades down 33% from its 2022 high of 214p. The share price has trended lower across the year to date, trading below its 2-month falling trendline and below the 50 & 100 sma. The 50 SMA has crossed below the 100 sna in a bearish signal.
The RSI remains in bearish territory, suggesting that there could be more downside.
140p, a more than two-year low, offered support in early April and is the level the bears will need to break below before bringing 125p, the 2021 low, into target.
Meanwhile, buyers will be looking for a move over the falling trendline at 146p and above last week’s high of 151p, to create a higher high and expose the 50 SMA at 161p.
How to trade with City Index
Follow these easy steps to start trading with City Index today:
- Open a City Index account, or log-in if you’re already a customer.
- Search for the market you want to trade in our award-winning platform.
- Choose your position and size, and your stop and limit levels
- Place the trade.
Latest market news
Yesterday 01:32 PM
Yesterday 09:35 AM
Yesterday 07:23 AM
Yesterday 04:48 AM
Yesterday 12:17 AM
July 25, 2024 10:39 PM
Latest Trade Ideas articles

Yesterday 09:35 AM

Yesterday 12:17 AM

July 25, 2024 10:39 PM

July 25, 2024 05:30 PM