


S&P 500, Nasdaq 100, DJIA Key Points
- After a week of digestion, traders will be focused on US CPI and Retail Sales to see if indices can extend their rallies further into record territory.
- The S&P 500 and Nasdaq 100 remain in clear “buy the dip” territory for now.
- The DJIA is the index to watch for a possible breakdown if stocks stall out this week.

Following on from a week highlighted by a surprisingly hawkish Fed meeting and a blowout NFP report, last week was always likely to be one where traders digested the big news of the previous week, rather than pushing market trends to new levels.
In terms of US economic data, the most significant release last week was the ISM Services PMI report, which true to form with recent US data, came in better than expected at 53.4 vs. 52.0 eyed and 50.6 last month. Digging into the details, the subcomponents of the survey supported the strong overall reading, with New Orders expanding for the 13th straight month and Employment shifting back into positive territory. Notably, the proportion of respondents reporting higher prices accelerated dramatically to 64.0%, no doubt validating the relatively hawkish positioning of the Federal Reserve for now. Outside of that report, US bond auctions generally went well and Fed speakers continued to back Chairman Powell’s general outlook.
Looking ahead to next week, the macroeconomic highlights include US CPI (expected at 0.3% m/m, 3.4% y/y) and US Retail Sales (expected at +0.6% m/m). Relative to expectations at the beginning of the year, the Fed looks highly unlikely to cut interest rates as much as was anticipated, which is a bearish development for stocks in a vacuum. But instead of falling, US indices have powered on to record highs on the back of strong earnings and the fact that the reason the Fed may not cut interest rates aggressively is because the US economy is performing so strongly.
In other words, far from being a “bad economic news is good news” environment, major US indices are remain in a “good economic news is good news” backdrop for now. A key theme for the coming week will be how equities navigate the major macroeconomic data and earnings reports (below).
Looking a bit further afield, the last of the “Magnificent Seven” stocks to report earnings will be Nvidia (NVDA) the week after this week.
Earnings Calendar, Week of February 12, 2024
Monday
- No top-tier earnings reports scheduled
Tuesday
- Coca-Cola (KO)
- Shopify (SHOP)
- Airbnb (ABNB)
Wednesday
- Cisco Systems (CSCO)
- Sony Group (SONY)
Thursday
- Applied Materials (AMAT)
- Deere and Company (DE)
Friday
- No top-tier earnings reports scheduled
S&P 500 Technical Analysis – SPX Daily Chart
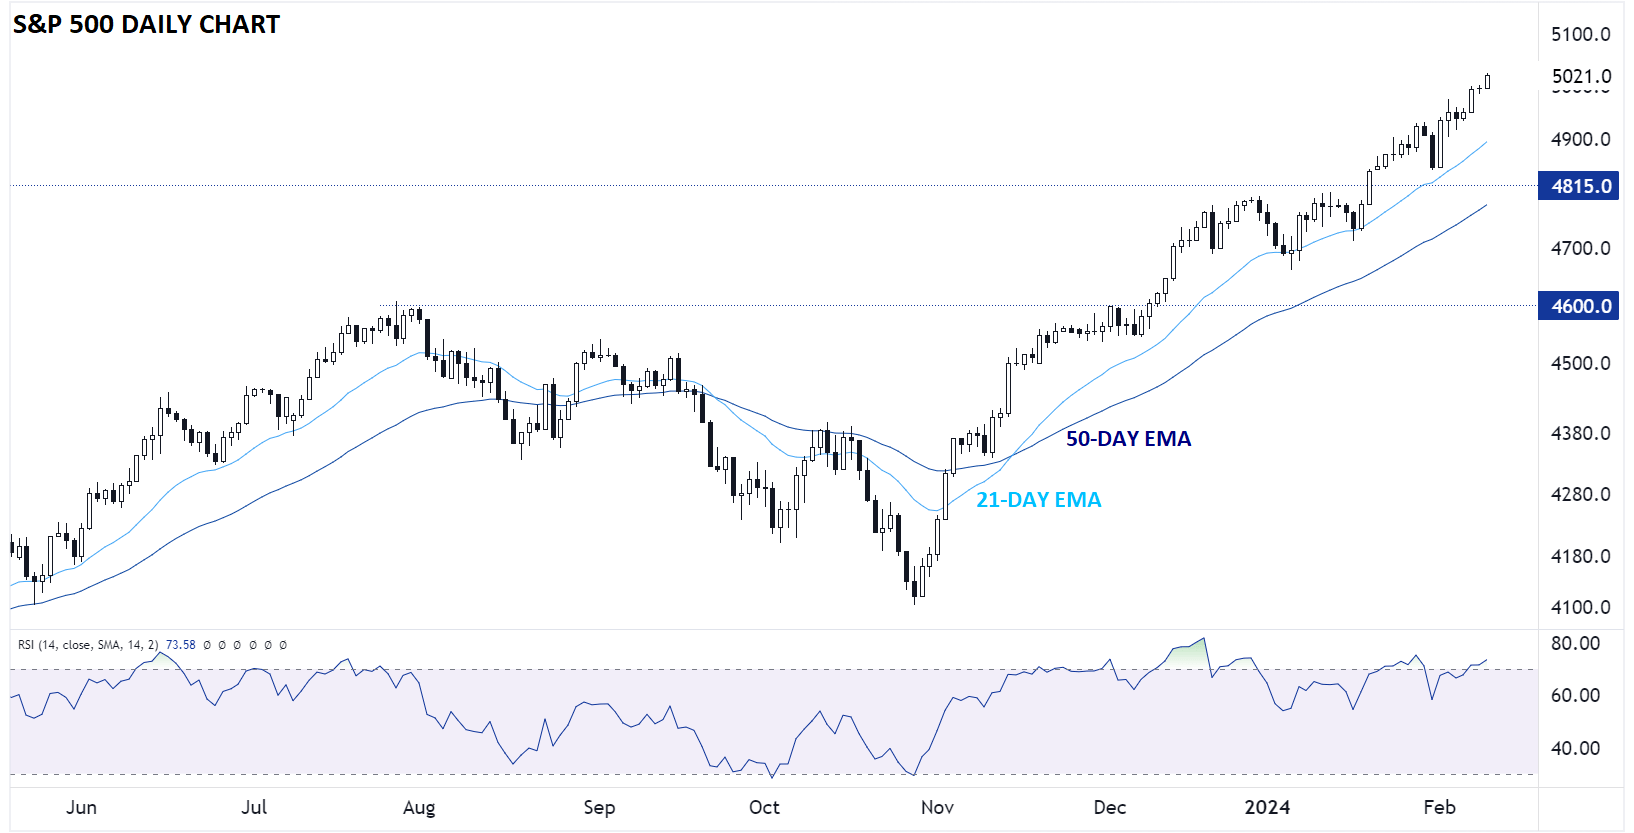
Source: TradingView, StoneX
Looking at the broad S&P 500 first, it’s hard to describe the chart as anything other than a strong, healthy uptrend. The 14-day RSI is technically in “overbought” territory (>70), but not at the extremes that we saw in December or even January, suggesting that the rally could well extend further from here.
As I noted in a previous article, the index has now risen 14 of the last 15 weeks. The forward returns from the (relatively infrequent) similar bullish thrusts in the past have been above average over the next 1-3 months, though the longer-term (6-12 month) returns have been below average. Longer-term concerns about narrow leadership remain notable, but unless/until the “Magnificent Seven” stocks start to stumble in unison, the S&P 500 remains in “buy the dip” mode.
Nasdaq 100 Technical Analysis – NDX Daily Chart
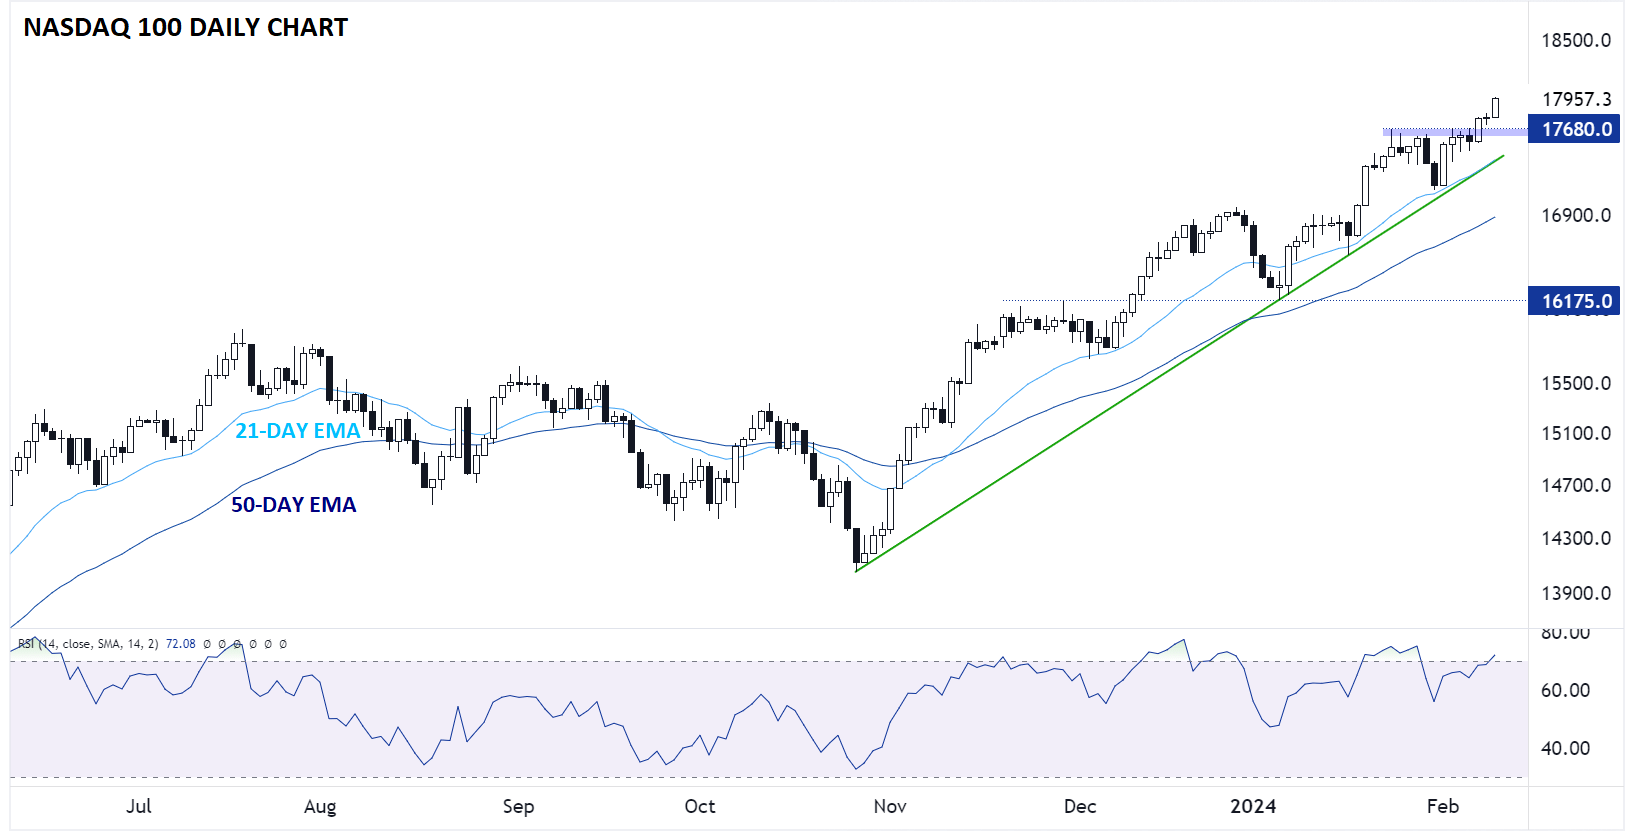
Source: TradingView, StoneX
The chart of the tech-heavy Nasdaq 100 looks similar, with the index probing 18K as the week comes to a close. The aforementioned narrow breadth concerns are even more pronounced with this index, but conversely, as those tech behemoths continue to rally day after day and week after week, the Nasdaq 100 widens its performance gap over its domestic rivals.
Readers may want to consider buying pullbacks toward the confluence of previous-resistance-turned-support, the 21-day EMA, and bullish trend line support in the mid-17Ks if they emerge this week, with only a break below that zone calling this possible “blowoff top” into question.
Dow Jones Industrial Average Technical Analysis – DJIA Daily Chart
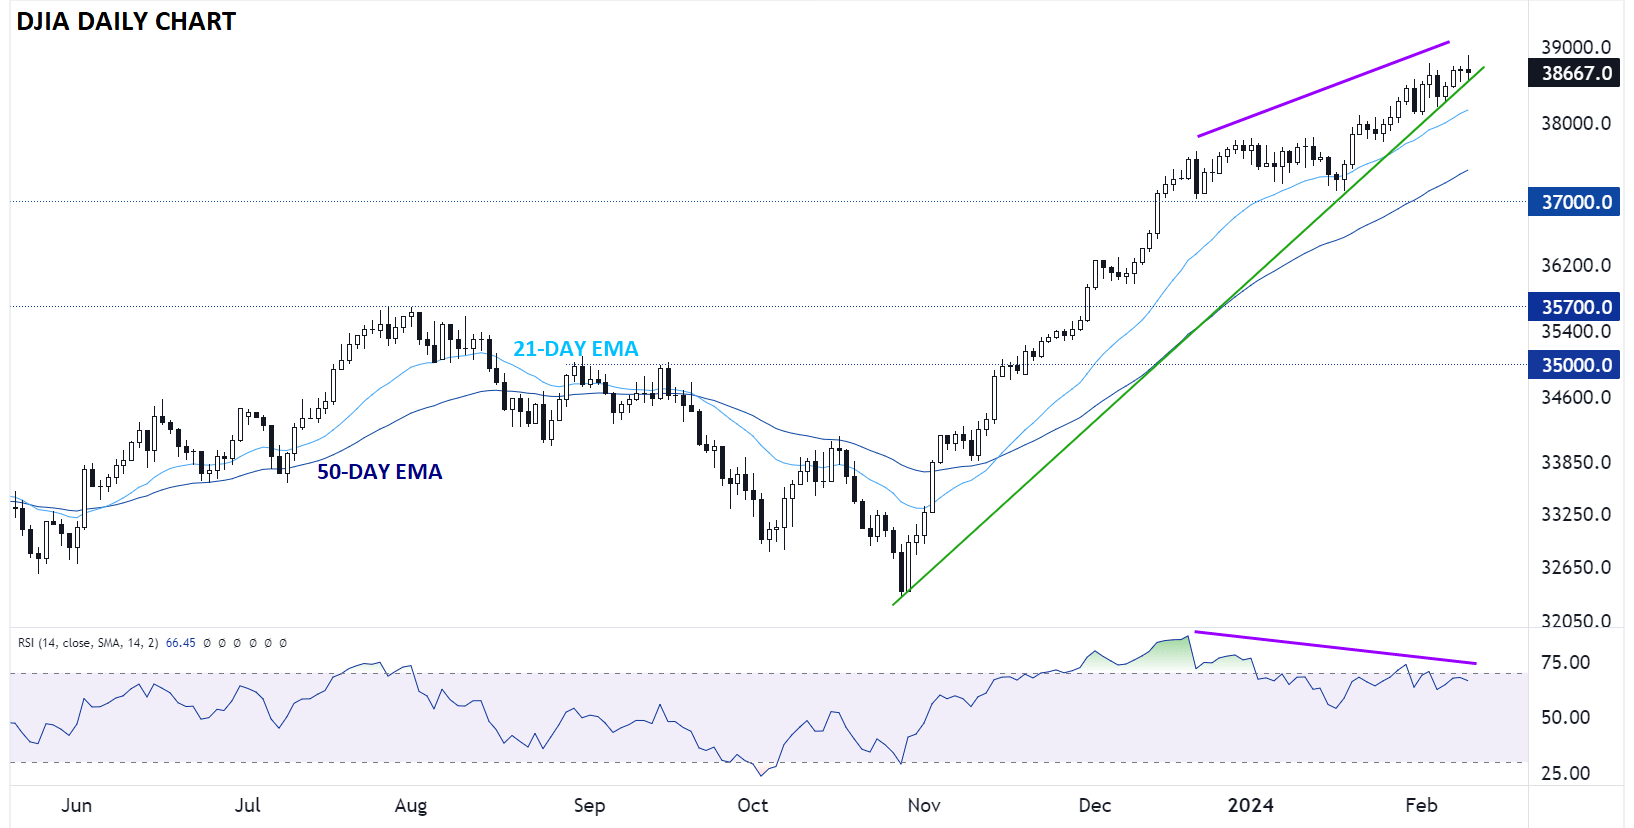
Source: TradingView, StoneX
Last but not least, the stodgy Dow Jones Industrial Average (DJIA) is the weakest of the major indices from a technical perspective, though it is still objectively in a strong uptrend. Though the path of least resistance remains to the topside here as well, traders looking to bet against the strong uptrend in US indices may want to focus first and foremost on the Dow for a potential break of its trend line that could herald a pullback toward the turn-of-the-year consolidation range in the mid-37Ks, especially with the RSI indicator showing a persistent bearish divergence at the current highs.
-- Written by Matt Weller, Global Head of Research
Follow Matt on Twitter: @MWellerFX
Latest market news
Yesterday 01:32 PM
Yesterday 09:35 AM
Yesterday 07:23 AM
Yesterday 04:48 AM
Yesterday 12:17 AM
July 25, 2024 10:39 PM
Latest Indices articles

July 25, 2024 01:30 PM

July 25, 2024 01:01 AM

July 25, 2024 12:41 AM

July 24, 2024 07:26 PM