


Key Points
- The S&P 500 ended 2023 on a 9-week winning streak, only its 3rd such streak in the past half century.
- Past 9-week winning streaks have historically led to above-average returns over the next 1 and 3 months, though the track record is about average over the next year.
- The near-term outlook points to a possible pullback in SPX toward 4700 or 4640 before the recent uptrend resumes.
Analyzing the S&P 500’s 9-Week Winning Streak
If you thought Taylor Swift ended 2023 on a high note, you should check out the S&P 500: The broad US stock index finished the year on a 9-week winning streak!
To put it bluntly, 9-week winning streaks are historically rare, and any time we see a rare market development, it can be beneficial to look at how the market has performed after past occurrences.
So how rare are 9-week winning streaks in the S&P 500 historically? Going back over the last 100 years, there have been just 13 prior 9-week winning streaks or an average of just one every 6.9 years. This represents a mere 0.28% of the 5,053 weeks in the sample. As rare as they’ve been historically, they’ve been even more uncommon in recent history; the last 9-week winning streak in the S&P 500 was in 2004, and there have been only three previous streaks in more than a half century!
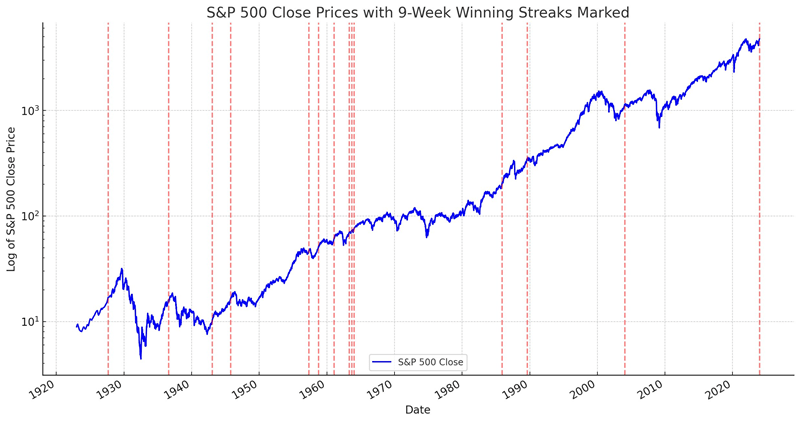
Source: Tradingview, StoneX
Any time stocks rise every single week for two straight months, you would expect some bullish complacency to set in, and that is absolutely a risk as we start a new year. The VIX, Wall Street’s “fear index” of implied volatility, ended the year with a 12-handle, and the track record of past 9-week S&P 500 winning streaks suggest we may see the bullish run come to an end soon. As the chart below shows, 8 of the previous 13 9-week winning streaks didn’t make it to 10 weeks, and all of the streaks ended within the next month:
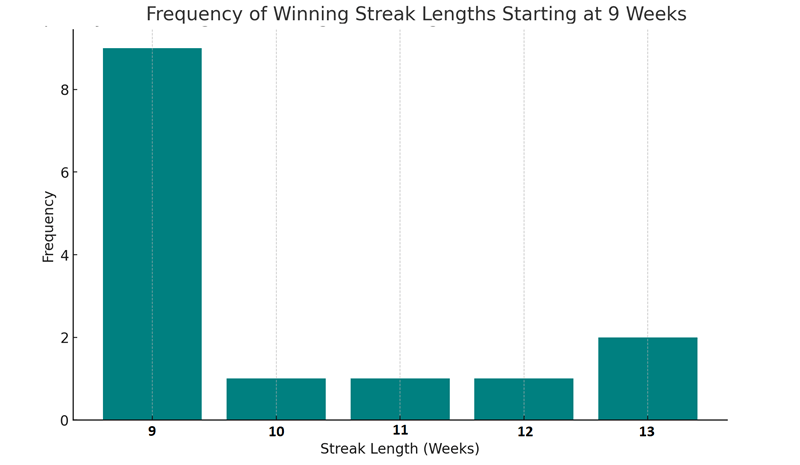
Source: TradingView, StoneX
Of course, traders are most interested in what the recent price action may mean for future moves. On that front, the short-term outlook may be a bit brighter than usual, if the historical record holds. Following previous 9-week winning streaks, the price-only return of the S&P 500 has been generally strong over the next 1 and 3 months, though returns over the next year have been mostly average:
- Avg. 4-week return = +1.5% (vs. 0.6% in all 4-weel periods)
- Avg. 13-week return = +4.2% (vs. 2.1% in all 13-week periods)
- Avg. 52-week return = +8.0% (vs. 8.5% in all 52-week periods)
Time will tell if the historical averages play out this time – after all, every market environment is different and other factors beyond a past winning streak will inevitably impact the S&P 500 returns – but the SPX’s strong run to end 2023 could well be a bullish sign for the first quarter of 2024.
S&P 500 Technical Analysis – SPX Daily Chart
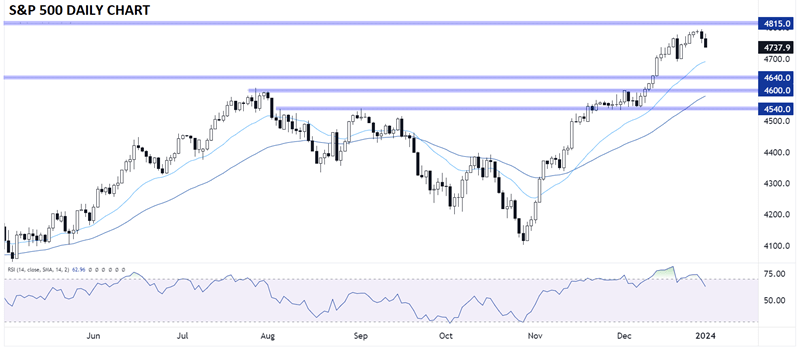
Source: TradingView, StoneX
From a more traditional technical analysis perspective, there’s certainly a case for a near-term pullback in the S&P 500. As the chart above shows, the index formed a bearish divergence with its 14-day RSI to finish 2023; this combination of a higher high in price and lower high in the momentum oscillator suggests that buying pressure was fading over the holidays and increases the odds of a near-term top forming.
To the downside, the first level of support to watch will be the December 20 low near 4700, with a break below that area opening the door for a deeper pullback toward previous-resistance-turned-support at 4640 or 4600. If bulls are able to get back into gear, the key resistance level to watch will be the all-time high around 4815.
-- Written by Matt Weller, Global Head of Research
Follow Matt on Twitter: @MWellerFX
Latest market news
Today 12:16 PM
Today 08:17 AM
Latest Technical Analysis articles


Yesterday 06:59 PM

Yesterday 11:09 AM

April 30, 2024 01:02 PM