


December 9, 2022 4:10 AM

Mexico’s headline CPI for November was “only” 7.8% YoY vs an expectation of 7.93% YoY and an October reading of 8.41% YoY. This was the lowest reading since May. However, November’s Core CPI rose to 8.51% YoY vs an expectation of 8.59% YoY and an October reading of 8.42% YoY. Although the print was lower than estimates, it was still higher than the previous month and the highest Core CPI reading since August 2000! The inflation data is likely to confirm the intentions of the Bank of Mexico (Banxico), that it will hike interest rates by 50bps when it meets on December 15th at its Interest Rate Decision meeting, a day after the Fed’s Interest Rate Decision. At its last meeting, Banxico hiked rates by 75bps to bring its benchmark rate to 10%. The central bank said that future rate hikes would be dependent of incoming data. However, it’s not a secret that Banxico has been mirroring the US Federal Reserve’s rate hikes since the spring. Fed Chairman Powell has well telegraphed the FOMC’s intention to hike by 50bps on Wednesday, December 14th, but will the Bank of Mexico do the same with Core inflation still climbing?
On a weekly timeframe, USD/MXN is trading in a pivotal area. The 19.5060/19.7530 area represents a key resistance area with the confluence of a trendline dating to July 2017, a downward sloping trendline dating to the highs of April 2020, and a well-defined resistance zone (formerly a support zone).
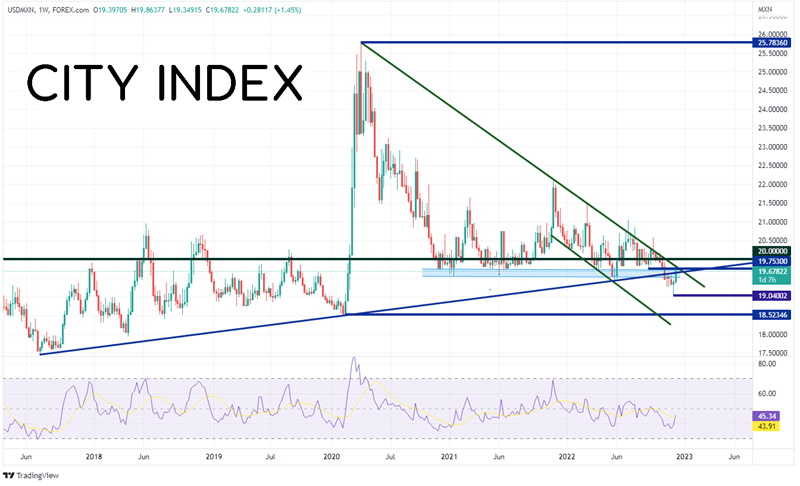
Source: Tradingview, Stone X
Trade USD/MXN now: Login or Open a new account!
On a daily timeframe, we can see a little more clearly how the previously mentioned resistance area is key. USD/MXN has been moving lower since April 2020 (see weekly). On November 4th, the pair finally cracked below the bottom of the support zone near 19.5060. The USD/MXN then continued lower until price briefly broke through the 161.8% Fibonacci extension from the lows of September 12th to the highs of September 28th, at 19.1888. On Friday, after the US Non-Farm Payrolls, the pair moved aggressively higher, which continued Monday, from a low of 19.1081 to a near-term high of 19.8621. But will it continue to move higher?
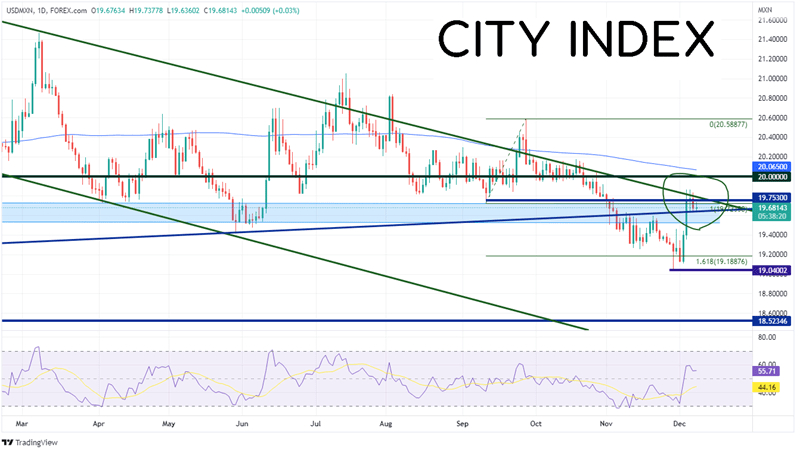
Source: Tradingview, Stone X
On a 240-minute timeframe, USD/MXN is consolidating in a pennant formation near the top of the resistance zone. The expectation is that price will break out in the previous direction of the pennant, which in this case would be higher. The target for a pennant is the height of the pennant pole, added to the breakout point, which is near 20.1424. However, if price can break above the long-term resistance discussed above, the next level of resistance is at the top of the pennant near 19.8621. Above there, USD/MXN can move to horizontal resistance from October near 19.7530, then the psychological round number resistance level of 20.0000. However, if the long-term resistance holds, first support is at the bottom of the flag (and the trendline dating to 2017) near 19.6272. Below there, price can fall to horizontal support at 19.4595, then the lows from December 5th at 19.3492.
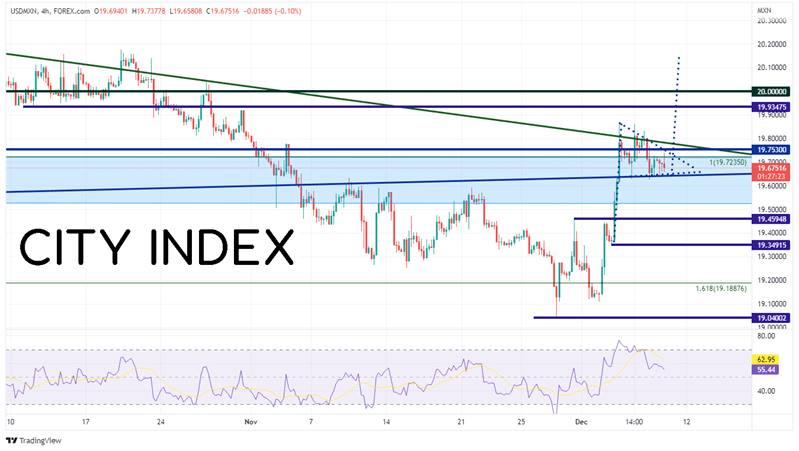
Source: Tradingview, Stone X
The release of the headline CPI for Mexico was lower than expected, however the Core CPI continued to rise to its highest level since April 2000. Will this cause the Bank of Mexico to hike rates by another 75bps when it meets next Thursday? Chances are that it won’t, as Banxico has been mirroring the Fed with its rate hikes. The Fed is only expected to hike 50bps the day before the Banxico meeting.
Learn more about forex trading opportunities.
Latest market news
Yesterday 01:32 PM
Yesterday 09:35 AM
Yesterday 07:23 AM
Yesterday 04:48 AM
Yesterday 12:17 AM
July 25, 2024 10:39 PM
Latest CPI articles

July 17, 2024 03:34 AM

July 12, 2024 10:38 AM

July 11, 2024 04:30 PM

July 11, 2024 11:00 AM