


Japanese yen takeaways
- Traders will get the latest updates on Q1 GDP, Industrial Production, Trade Balance, and National CPI data out of Japan over the next 48 hours.
- USD/JPY found support at its rising trend line and 50-day EMA last week, keeping the near-term bullish bias intact.
- The next resistance level to watch will be the year-to-date high near 138.00.
Japanese yen fundamental analysis
Ahead of this weekend’s G7 summit in Hiroshima, it’s a big week for Japanese economic data. Over the next 48 hours, traders will be treated to the latest updates on Q1 GDP, Industrial Production, Trade Balance, and National CPI data.
Outside of traditional economic data, it’s also notable that the Prime Minister Kishida has called for the BOJ to exam the sustainability of recent wage increases, a possible precursor to an eventual hawkish shift in monetary and/or fiscal policy, though like everything in Japan, that may take longer than many traders would hope to bear fruit.
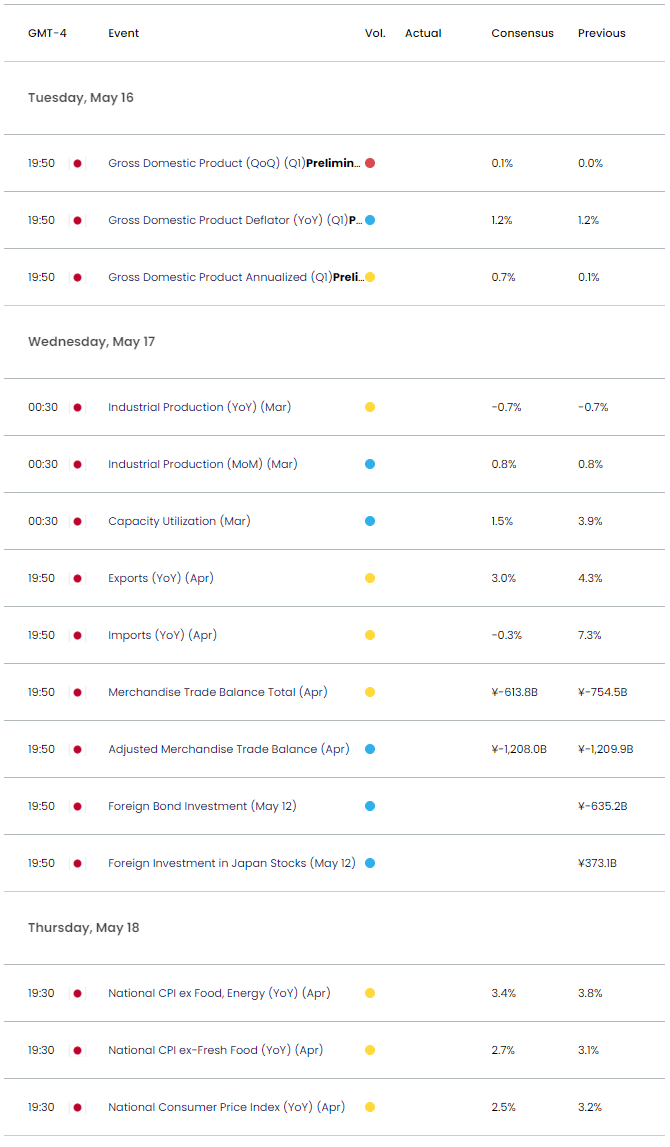
Source: StoneX
Japanese yen technical analysis – USD/JPY daily chart
Turning our attention to the daily chart of USD/JPY, rates remain in an uptrend after testing rising trend line support and the 50-day EMA midway through last week. Today’s rally is particularly impressive given this morning’s lackluster US data, with retail sales rising by just 0.4% month-over-month, half of the projected 0.8% gain:
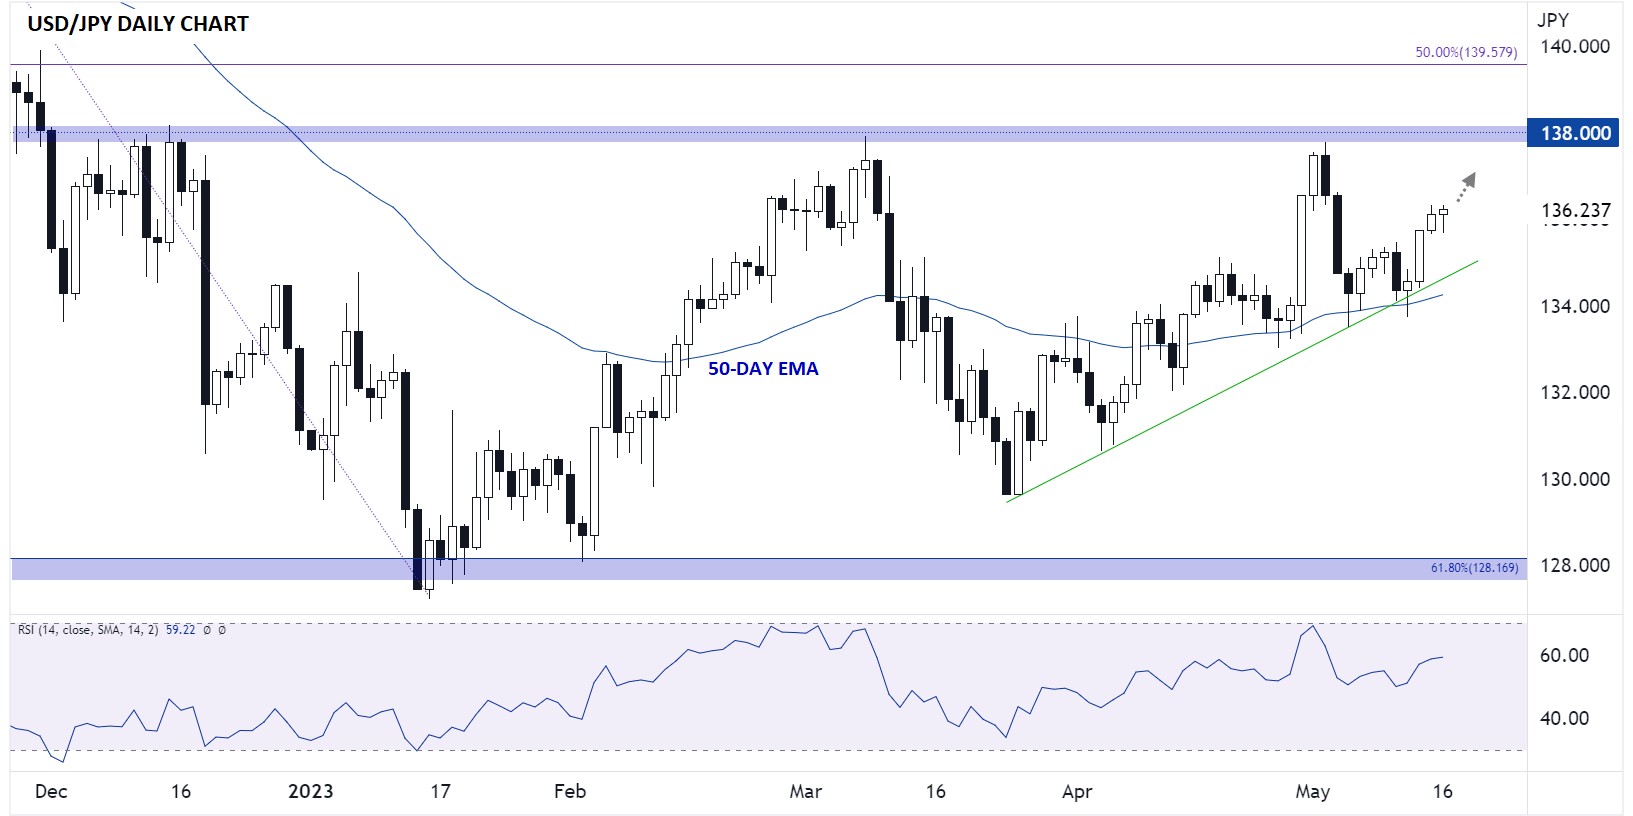
Source: Tradingview, StoneX
Moving forward, USD/JPY has little in the way of nearby resistance, and bulls may therefore look to drive the pair back toward its year-to-date high near 138.00, especially if Japanese economic data comes in worse than expected. At this point, only a bearish reversal back down below the confluence of the rising trend line and 50-day EMA near 134.50 would erase the current bullish bias and open the door for additional losses.
-- Written by Matt Weller, Global Head of Research
Follow Matt on Twitter: @MWellerFX
How to trade with City Index
You can trade with City Index by following these four easy steps:
-
Open an account, or log in if you’re already a customer
• Open an account in the UK
• Open an account in Australia
• Open an account in Singapore
- Search for the market you want to trade in our award-winning platform
- Choose your position and size, and your stop and limit levels
- Place the trade
Latest market news
Yesterday 01:32 PM
Yesterday 09:35 AM
Yesterday 07:23 AM
Yesterday 04:48 AM
Yesterday 12:17 AM
July 25, 2024 10:39 PM
Latest Japan articles

May 29, 2024 06:30 AM

April 11, 2024 11:15 PM

February 27, 2024 12:54 AM

February 21, 2024 06:12 AM