


USD/JPY takeaways
- After this morning’s strong US data, traders are now pricing in a nearly 75% chance of another 25bps rate hike from the Fed by July.
- Tomorrow’s US Core PCE report, the Fed’s preferred inflation measure, is the key fundamental data release to watch.
- USD/JPY remains in a bullish short-term trend, with room to extend its rally toward 142.00 before encountering meaningful resistance.
USD/JPY fundamental analysis
Debt ceiling, schmebt ceiling.
Despite a potentially worrying lack of progress toward a US debt ceiling deal ahead of next week’s deadline (and the accompanying news that ratings agency Fitch has put the US credit rating on negative watch for a potential downgrade), the US dollar is the strongest major currency on the day.
Part of the boost comes from economic data: This morning, Q1 GDP for the US was revised to 1.3% q/q, beating expectations for a 1.1% print, and initial unemployment claims came in at just 229K, solidly below the 249K reading anticipated by economists.
With both backward-looking and coincident data showing a stronger-than-expected US economy, traders have started to seriously consider the prospect of another interest rate hike from the Federal Reserve. Once seen as a longshot, traders are now pricing in a nearly 3-in-4 chance that we could get another 25bps increase in one of the next two Fed meetings, per the CME’s FedWatch tool:
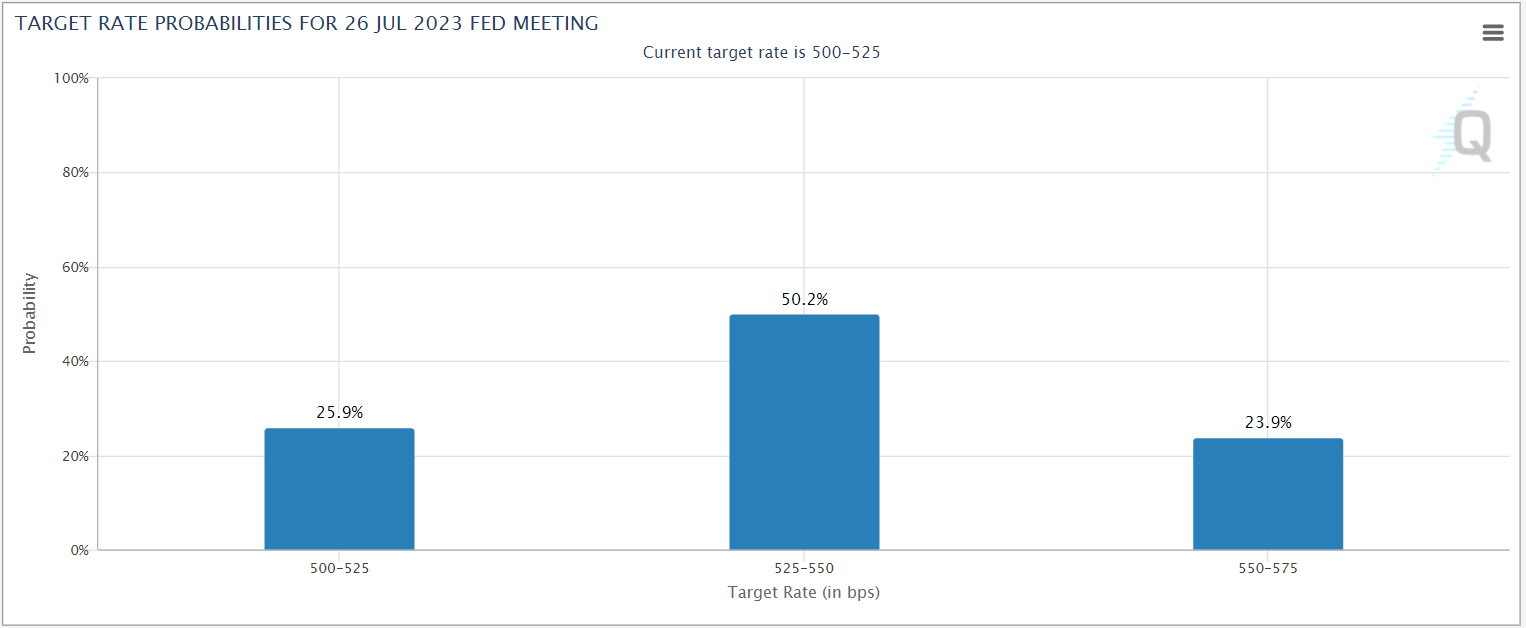
Source: CME FedWatch
Tomorrow’s Core PCE report, the Fed’s preferred measure of inflation, will be the economic data highlight for the week, with economists looking for a 0.3% m/m print that would leave the year-over-year rate steady at 4.6%. A higher-than-expected reading here would increase the market’s expectations for another Fed hike, marking a particularly sharp divergence with the BOJ’s ongoing easy monetary policy.
Japanese yen technical analysis – USD/JPY daily chart
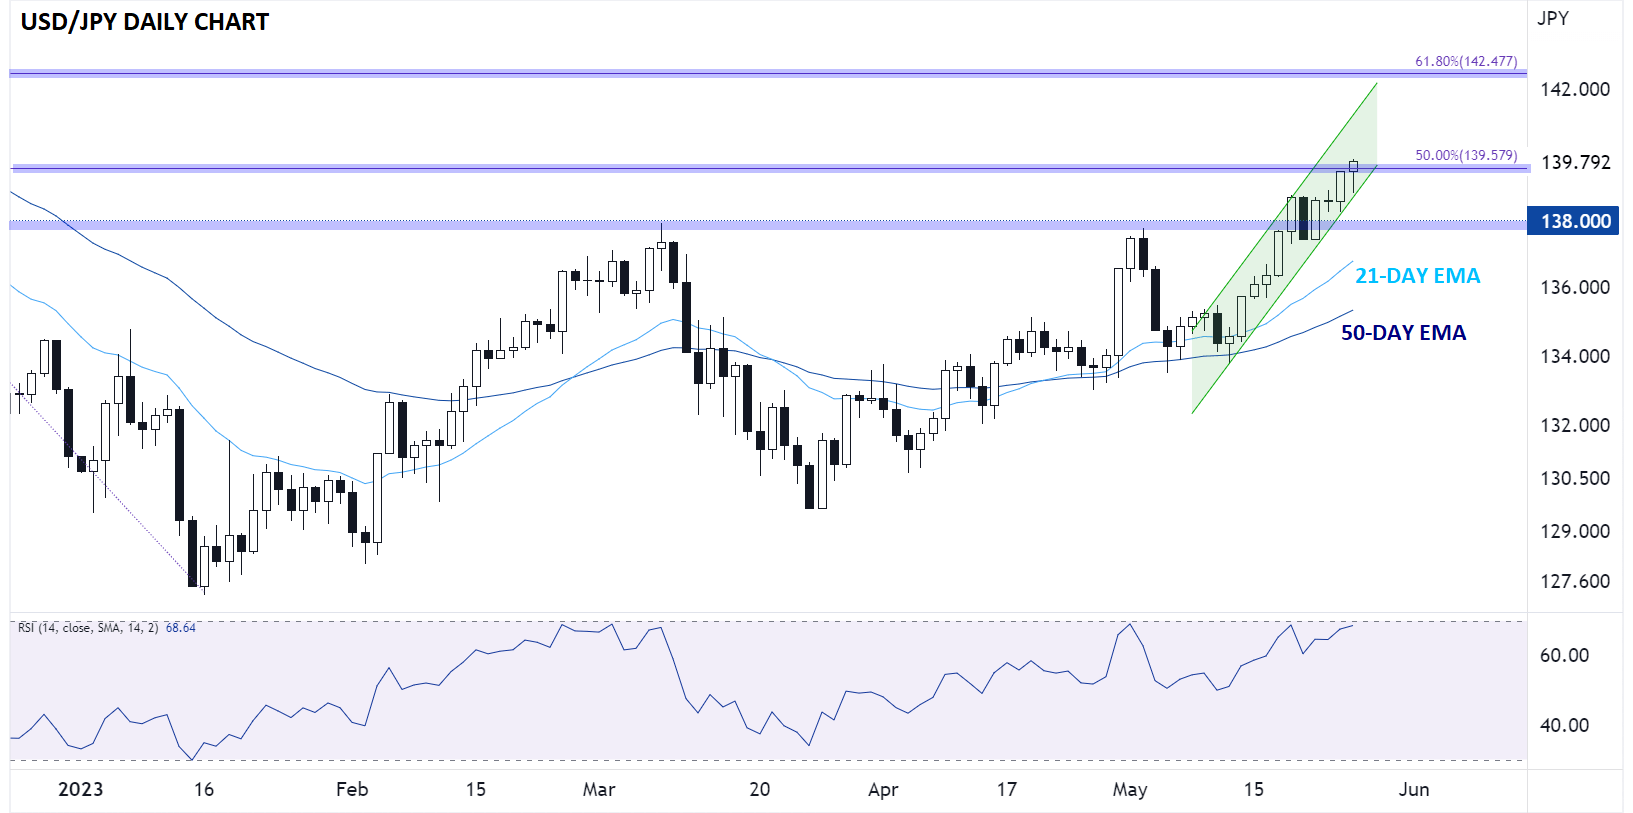
Source: Tradingview, StoneX
Looking at the daily USD/JPY chart, rates continue to rise within a well-defined 2-week bullish channel. The pair has now eclipsed its year-to-date high near 138.00, and as of writing, rates are peeking out above the 50% Fibonacci retracement of the October-January drop near 139.60.
A clean break above that level (perhaps helped along by a hot Core PCE reading tomorrow) would leave little in the way of nearby resistance until closer to 142.00, where the 61.8% Fibonacci retracement and a minor high from November converge. Only a break back below the bullish channel and previous-resistance-turned-support at 138.00 would erase the near-term bullish bias.
-- Written by Matt Weller, Global Head of Research
Follow Matt on Twitter: @MWellerFX
Latest market news
Yesterday 01:32 PM
Yesterday 09:35 AM
Yesterday 07:23 AM
Yesterday 04:48 AM
Yesterday 12:17 AM
July 25, 2024 10:39 PM
Latest USD/JPY articles

Yesterday 07:23 AM

July 25, 2024 10:39 PM

July 25, 2024 08:50 AM

July 25, 2024 04:37 AM