


Looking across several timeframes suggest that the Hang Seng is moving towards a larger move, whilst prices coil on lower timeframes.
Hang Seng Index (monthly chart):
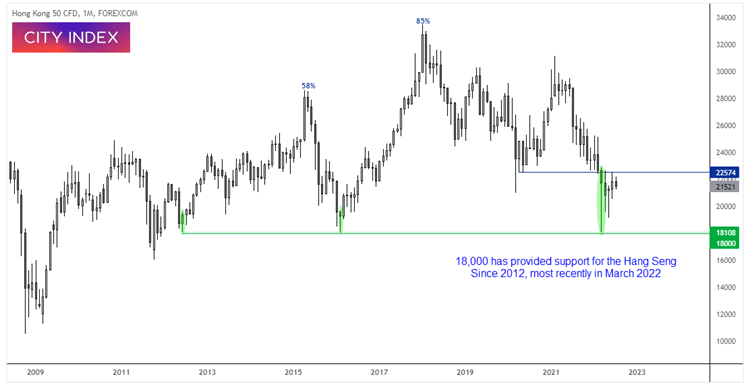
We can see on the monthly chart that 18,000 has provided support since 2012, with the most recent low forming in March this year. The market rallied around 58% from the 2012 low and 85% from the 2016 low.
At this stage we do not know if this is a multi-year bullish continuation, or reversal pattern. If this is part of a head and shoulders top, we could assume that a break above 22,600 may top out below 28,650 (the left shoulders or 58% rally).
But if prices remain below 22,600 then we will be looking for a potential break below 18,000 to mark a major reversal. As this is the monthly chart we have time on our side.
Hang Seng Index (weekly chart):
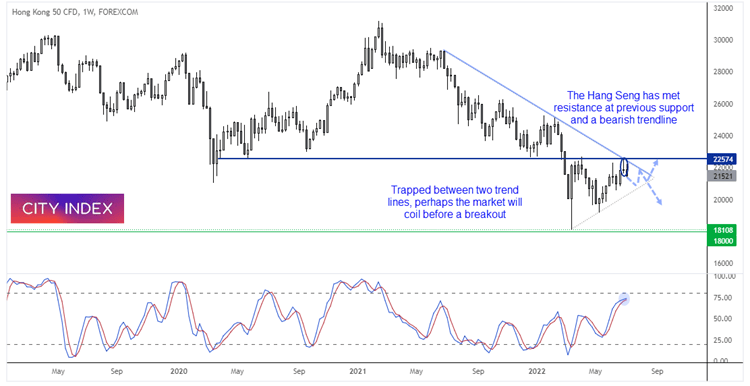
When looking for a high conviction for potential direction, we’d prefer to see multiple timeframes align for the analysis. Yet that’s not what we are seeing on the weekly chart. Whilst the Hang Seng has printed a higher low from 18,000, it has met resistance at 22,574 support and a bearish trendline. A bearish hammer formed at this key level last week and the market is back below 22,000. The stochastic oscillator also shows the potential to provide a sell signal, so perhaps the Hang Seng to dip lower on the weekly chart.
Perhaps we may see the market coil between the two trendlines until a sustained move is seen in either direction. Ultimately we need to see a break above 22,600 to confirm the next leg higher, whilst a break of the lower trendline suggests momentum has realigned with the bearish trendline.
Hang Seng (daily chart):
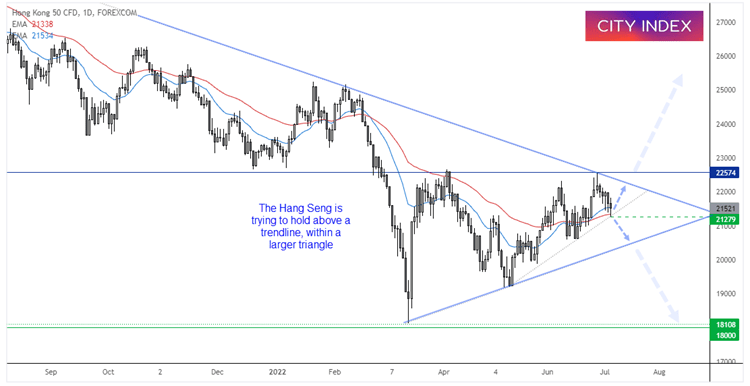
The daily chart is currently holding above trend support and the 20/50-day eMA within a larger triangle.
- Whilst prices hold above 21,280 then it may provide bullish setups on lower timeframes, over the near-term.
- A break of yesterday’s low invalidates the near-term bullish bias and brings the lower trendline into focus for bears.
- Due to the conflicting inflation across the three timeframes, traders may want to remain nimble and not seek large swings until we see a break above 22,600 or below the lower trendline.
How to trade with City Index
You can easily trade with City Index by using these four easy steps:
-
Open an account, or log in if you’re already a customer
• Open an account in the UK
• Open an account in Australia
• Open an account in Singapore
- Search for the company you want to trade in our award-winning platform
- Choose your position and size, and your stop and limit levels
- Place the trade
Latest market news
Yesterday 01:32 PM
Yesterday 09:35 AM
Yesterday 07:23 AM
Yesterday 04:48 AM
Yesterday 12:17 AM
July 25, 2024 10:39 PM
Latest Technical Analysis articles

July 25, 2024 03:59 PM

July 24, 2024 07:26 PM

July 24, 2024 09:55 AM

July 23, 2024 11:58 AM