


- Gold analysis: how to trade the metal around CPI release
- USD/JPY analysis: technical levels to watch
- CPI seen rising to 3.2% from 3.1%

The imminent release of the US inflation report at 13:30 GMT has captured everyone's focus, holding the potential to inject much-needed volatility into the FX markets, which have been relatively calm throughout the week thus far. Major currency pairs are gearing up for potentially significant moves, but don’t forget about gold and silver, with the buck-denominated assets also likely to move sharply on the back of the CPI data.
What to expect from CPI data
Analysts anticipate that the US CPI data will indicate an increase in inflation, reaching an annual rate of 3.2% in December on a headline basis, as opposed to the 3.1% recorded in November. On a monthly basis, it is expected that the CPI will show a 0.2% uptick, following a 0.1% rise in the previous month. The core reading, excluding food and energy, is projected to be 3.8% year-on-year or 0.3% month-on-month.
Gold analysis: how to trade the metal around CPI release
So how do we trade the CPI report? There are obviously many ways but for most traders waiting for the actual data makes more sense than trying to pre-empt it. More often than not, the initial data-driven move does retrace before resuming in the direction of the surprise – and sometimes even completely reverses. What’s more, an in-line reading could weigh on the dollar given that the market is potentially positioned for a strong report, with the dollar rising last week. So, if you are a more conservative-type trader, t is best to wait until after the data is released, see how gold has reacted and then potentially trade accordingly.
You can obviously trade gold in either direction, but sometimes it is a better idea to have two contrasting trades in mind and trade one or the other market depending on the outcome of the data. With that in mind, the JPY has been among the weakest performers this week after Tokyo CPI came in slightly below forecasts and wage growth contracted sharply, suggesting that the BoJ will potentially delay its policy normalisation process. This makes the USD/JPY a long candidate if the CPI turns out to be stronger. However, if the data disappoints or the US dollar otherwise reacts negatively to the inflation report, then looking for long gold setup may make more sense.
Gold technical analysis
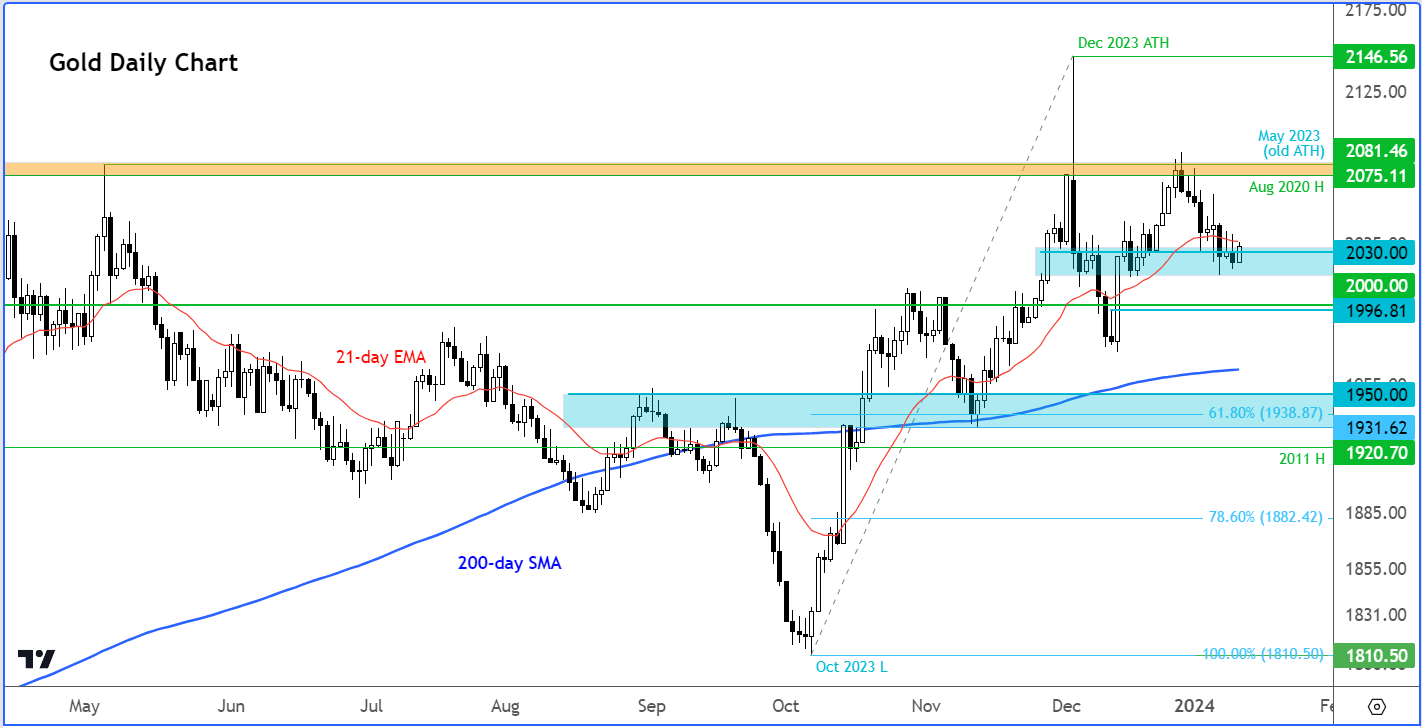
All week, gold has been trying to find support from around $2030 but so far there has been no decisive move from around this level. After today’s CPI data is out of the way, bullish traders will want to see evidence and a clear bullish signal to confirm that the metal has formed a low. If that is the case, then we could see the onset of a rally towards $2075, the high from August 2020, which is going to remain a pivotal zone for gold. The metal has not been able to post a weekly close above this level. If and when it does, then the December 2023 high of $2146 will come into focus next.
However, if support around $2030 breaks decisively then the next key level to watch is around $2000, the psychologically-important level, followed by $1950, which roughly corresponds with the 200-day average and prior support.
USD/JPY analysis: technical levels to watch
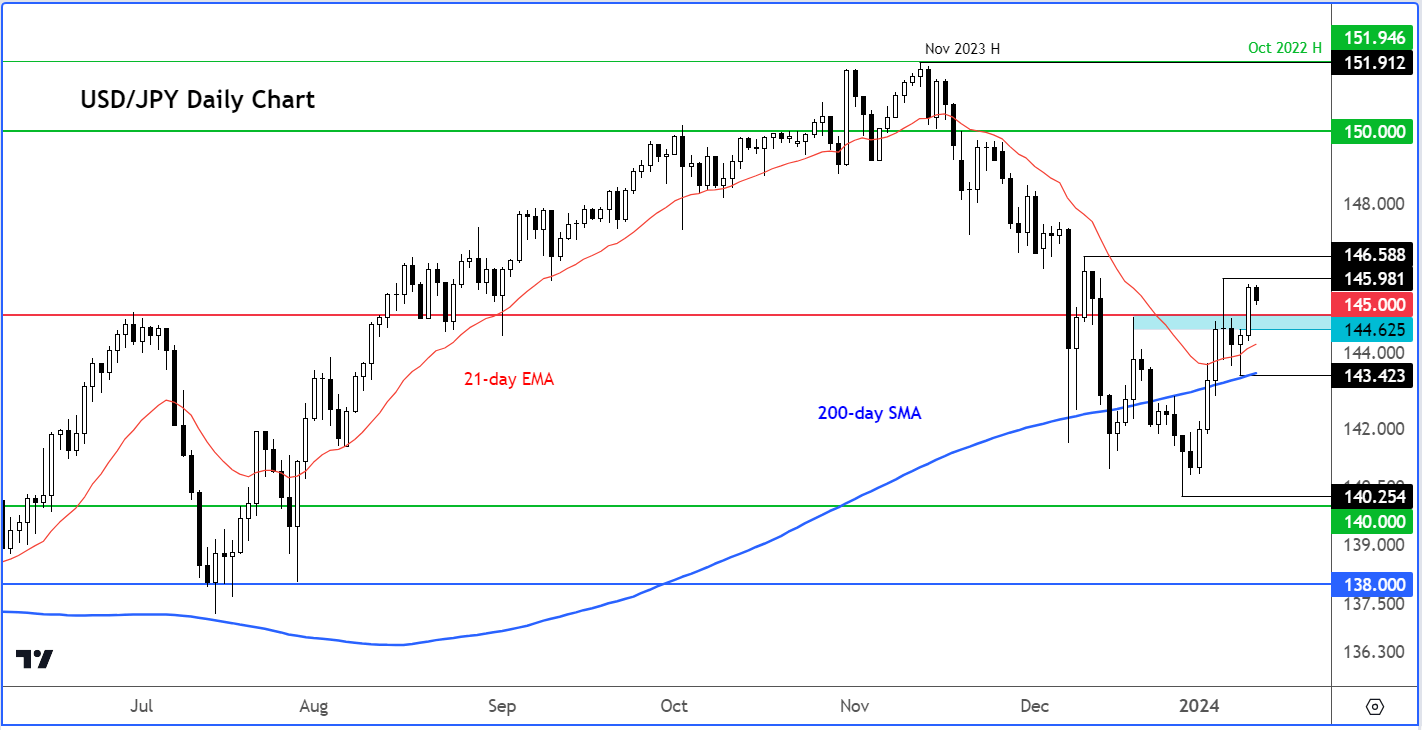
The USDJPY was a touch weaker ahead of the CPI data, but it has been trending higher in recent days. The key levels of support to watch include 145.00, a psychologically significant level, followed by 144.62, corresponding to the head of the hammer candle observed on Tuesday. Below these levels, we have the 200-day average around 143.40 – a shift to a bearish bias is likely if this level is decisively breached.
On the upside, the first level to watch is around 146.00, roughly corresponding to last week’s high (145.98). Above this level we have 146.60, representing the pre-FOMC high established on December 11.
Source for all charts used in this article: TradingView.com
-- Written by Fawad Razaqzada, Market Analyst
Follow Fawad on Twitter @Trader_F_R
How to trade with City Index
You can trade with City Index by following these four easy steps:
-
Open an account, or log in if you’re already a customer
• Open an account in the UK
• Open an account in Australia
• Open an account in Singapore
- Search for the company you want to trade in our award-winning platform
- Choose your position and size, and your stop and limit levels
- Place the trade
Latest market news
Yesterday 11:57 PM
Yesterday 08:00 PM
Yesterday 02:00 PM
Yesterday 08:00 AM
April 27, 2024 11:00 PM
Latest USD JPY articles


April 26, 2024 11:40 AM

April 24, 2024 03:14 PM

April 24, 2024 08:15 AM