


Gold, XAU/USD Talking Points:
- Spot gold prices are showing a near 12% gain in 2023 trade, in stark contrast to the doji that built during 2022.
- Gold price action tracked risk themes throughout the year and like stocks, gold began to rally early in the year and that largely continued save for a couple of pullbacks, one of which was prolonged from May into October. The response to that pullback was intense.
- As the door opens into 2024 the big question is the Federal Reserve and possible policy pivots. And it’s an election year in the US, so there could be even more motivation for volatility in a market like gold.
Something important happened to the macro trade in Q4 of 2022, and this is evident in numerous markets. This is when the S&P 500 was setting its current three-year low, and it’s right around the time that markets started to gear up for the Federal Reserve to move away from their heavy-handed rate hikes designed to temper inflation. At the time, gold was trading around the $1650 level and a strong bounce developed in Q4 of 2022 as market participants tried to get in front of a possible policy pivot.
A year later, and we’re still hanging on to the same hope with a fresh injection of optimism after the December FOMC rate decision in which FOMC Chair Jerome Powell noted that the bank had started the conversation around possible rate cuts. While that’s been walked back by other Fed members in the days since, the bullish move in gold is still there, and if we look at the weekly chart its impact is quite visible.
That optimistic bullish theme ran into May of this year, after which it began to pullback. But to tell the story of 2023 price action in gold we really need to drive back to Q4 of 2022 when the current trend started to run, and below is the origin story.
Gold Weekly Price Chart (XAU/USD)
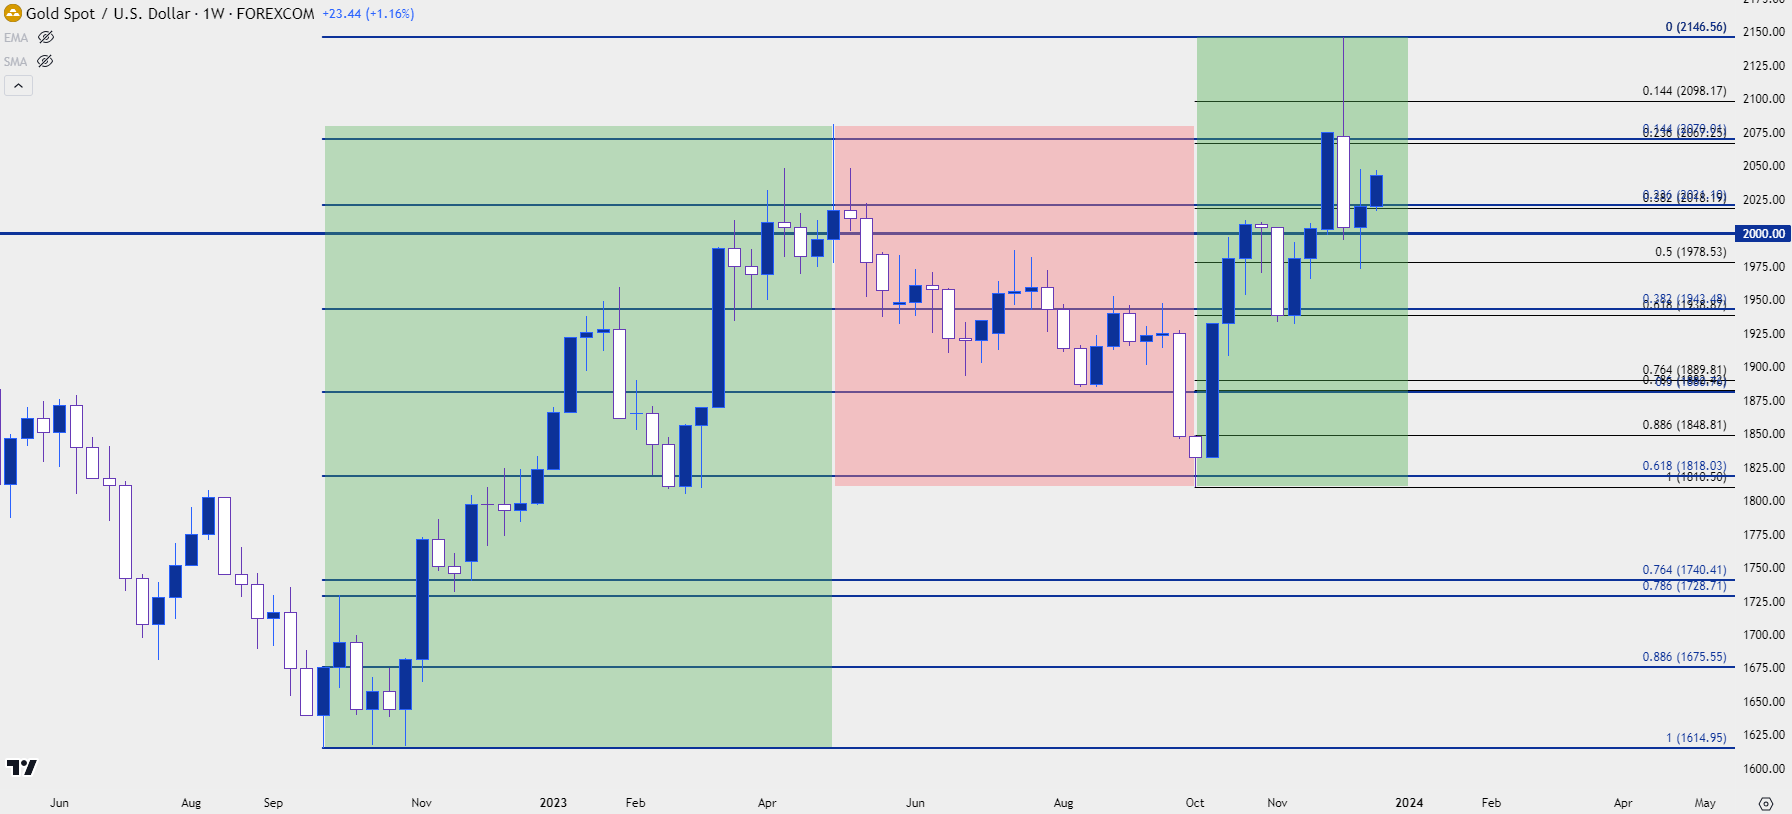 Chart prepared by James Stanley, Gold on Tradingview
You’ll probably notice from the above chart that it wasn’t all green pastures this year for gold bulls, as there was a five-month pullback that began in May and ran through early-October.
That was a 61.8% Fibonacci retracement of the bullish move, and support started to show up in early-October. But it’s the sell-off that led into that which is of interest as that move was largely pushed by a really strong US Dollar. The USD was bid through much of the summer as markets geared up for the possibility of more rate hikes from the Fed. But as that message began to soften and as the likelihood of another hike began to fall, matters started to shift.
It wasn’t readily apparent in gold as it had come into the month of October in a deeply oversold state, eventually going down to sub-20 reads on daily RSI. As I had written at the time, this is pretty rare as there’s been less than a handful of similar occurrences over the prior 20+ years. But the impact was intense as the day after I published that article gold started to show topside drive, such as a bullish outside daily bar on the morning of NFP on October 6th.
That weekend was when the Middle East tensions rushed back into the news and the next weekly open saw the war bid price in, which launched a bullish continuation theme. Less than two months later spot gold had set a fresh all-time-high 18.56% away from the October low, taken from the morning of that NFP report. But matters aren’t as clear cut, as price was at a major zone of resistance that wasn’t going to give way that easily.
Gold Daily Price Chart (XAU/USD)
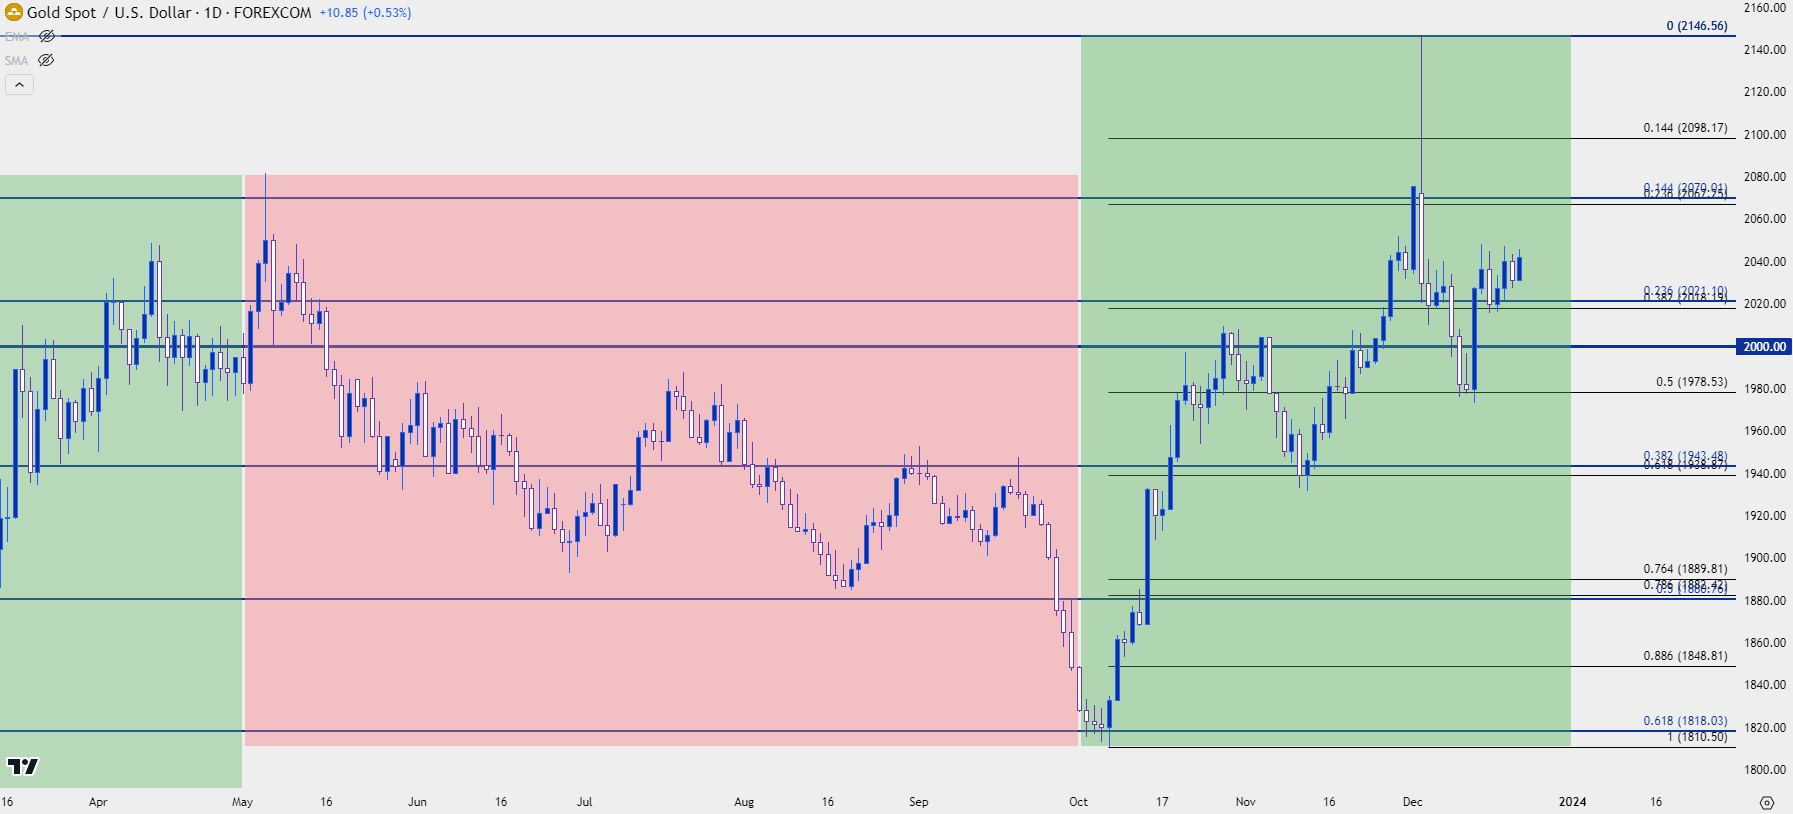 Chart prepared by James Stanley, Gold on Tradingview
Gold Breakout Fake-Out, Powell to the Rescue
It was the first Sunday open of December but an intense move showed up in gold just after the open, allowing for spot to rush all the way up to a fresh all-time-high at 2146. Given how quickly that order had priced in along with the time that it happened, it certainly seemed as though there was a liquidity function there, as well, as Sunday opens aren’t usually the most liquid time of the week for a commodity like gold.
Ahead of this I had talked about the prospect of a ‘capitulation wick’ to mark the top of the move. This would be similar to looking for a pin bar or a shooting start to plot a reversal, and as the move reversed more and more, the prospect of bearish pressure started to come back into the picture. Soon, we were back below the $2k figure and as we moved into FOMC, gold was holding support around 1975.
Powell surprised in how dovish he was, at least to me, and the net response was fairly clear as the Dollar took a heavy hit and this helped to boost risk assets, gold included. Gold put in another bullish outside day after that rate decision and prices pushed back above $2k. But the motivation was clear as it was Powell talking down the prospect or rate hikes and the potential for cuts in 2024 that got bulls excited, and this can give us something to work with as we move into the New Year. That has since been talked back a bit by other Fed members, and this will remain a cog in the equation as we move into 2024.
Gold Daily Price Chart
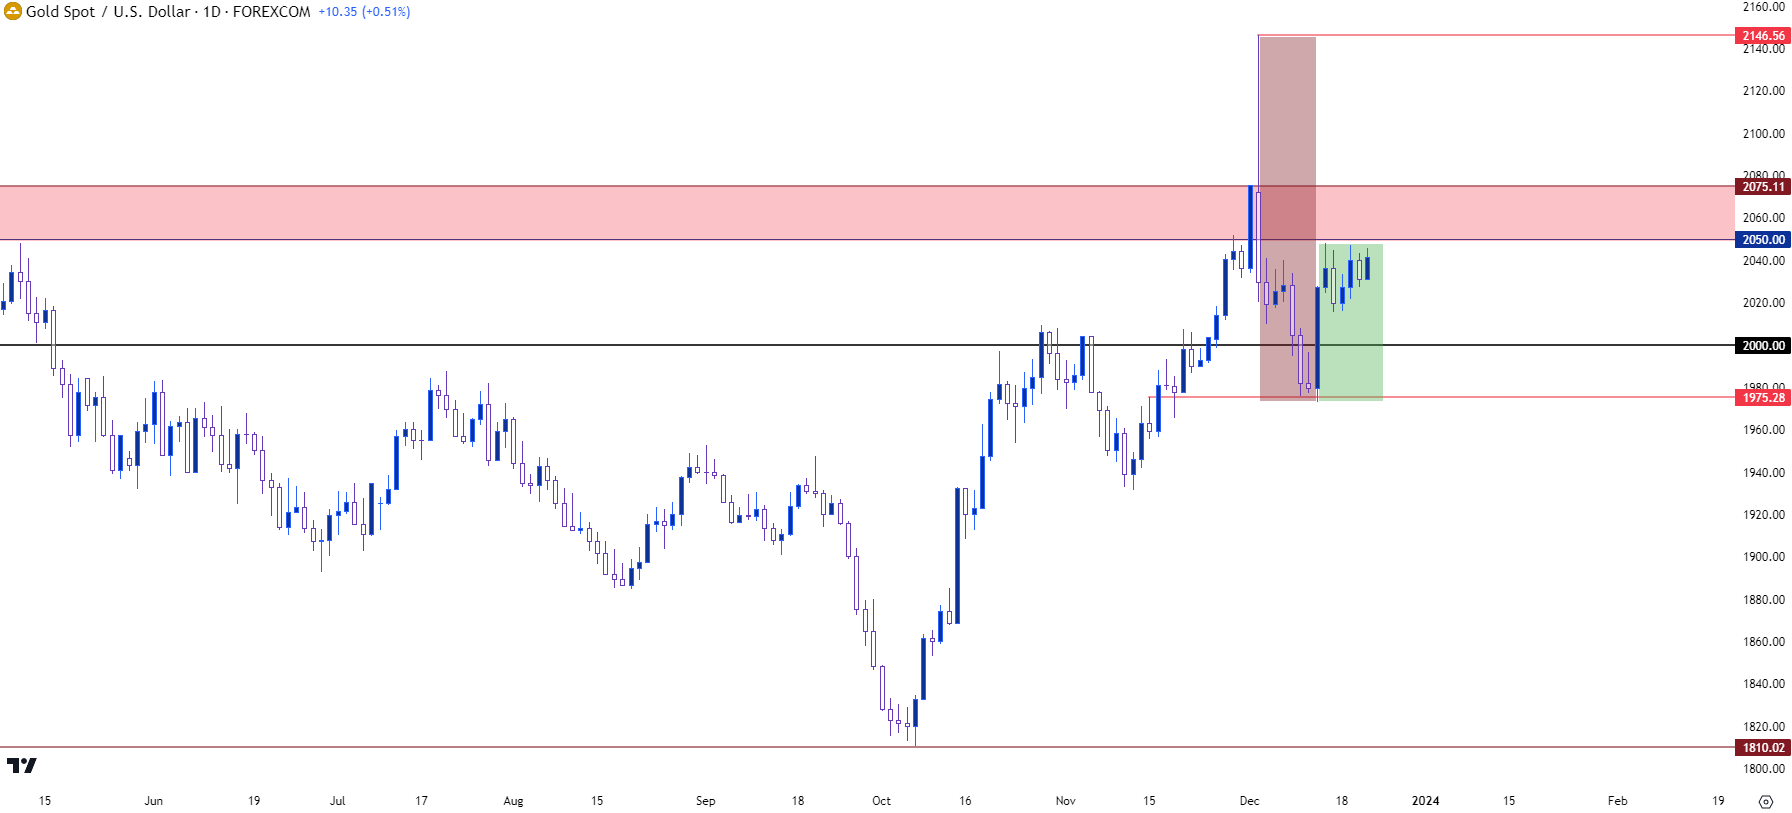 Chart prepared by James Stanley, Gold on Tradingview
Gold Longer-Term: Is 2024 The Year of the Breakout?
I’ve long said that, in my opinion, gold can show that sustained breakout above $2k after the Fed formally pivots. Recent history would suggest some form of relationship between expectations around the FOMC and gold price action. But, perhaps more to the point, there’s some historical relevance here, as well.
When gold was trying to gain acceptance over the $1k figure it took about 18 months, even with the Fed pumping aggressively after the Financial Collapse. The first test of $1k showed in March of 2008, around the time that Bear Sterns was hit. And while this provided some shock to global markets it seemed to be shrugged off for a couple of months as the S&P rallied in April and May of that year.
Gold continued to pullback and by October of 2008, as the Financial Collapse was developing, gold had given back -34% in six months. The second test of $1k happened almost a year after the first, in February of 2009 and once again, bulls were stymied.
Gold finally broke through the $1k level in September of 2008 and hasn’t looked back since.
The saga with $2k seems somewhat similar as the first test of that level came in a few months after covid came into the picture. And as the Fed pumped to a heavy degree, gold engaged with the big figure but still couldn’t gain enough acceptance to continue the drive. Interestingly, it seemed the anti-USD attention turned to Bitcoin as BTC/USD was trading around $12k the first time that gold tagged $2k. And as gold ranged for the next year and change, Bitcoin broke out in a very big way.
In gold, this really harkens to the value or importance of psychological levels, themselves, as these are massive prices that can create changes in consumer behavior that can have repercussions on short-term trends and themes. The price of $1,000.01 seems much more expensive than just two cents about $999.99; and this is just a part of the human condition in which our brains attempt to simplify. The bigger number, even if just two cents, seems much larger given the extra digit and this is something that can impact consumer and investor behavior, as we’ve seen for the past three and a half years with gold.
The test at $2k has been much longer than what was seen at $1k, but there’s also the matter of inflation to consider…
Gold Monthly Price Chart: $1k to $2k
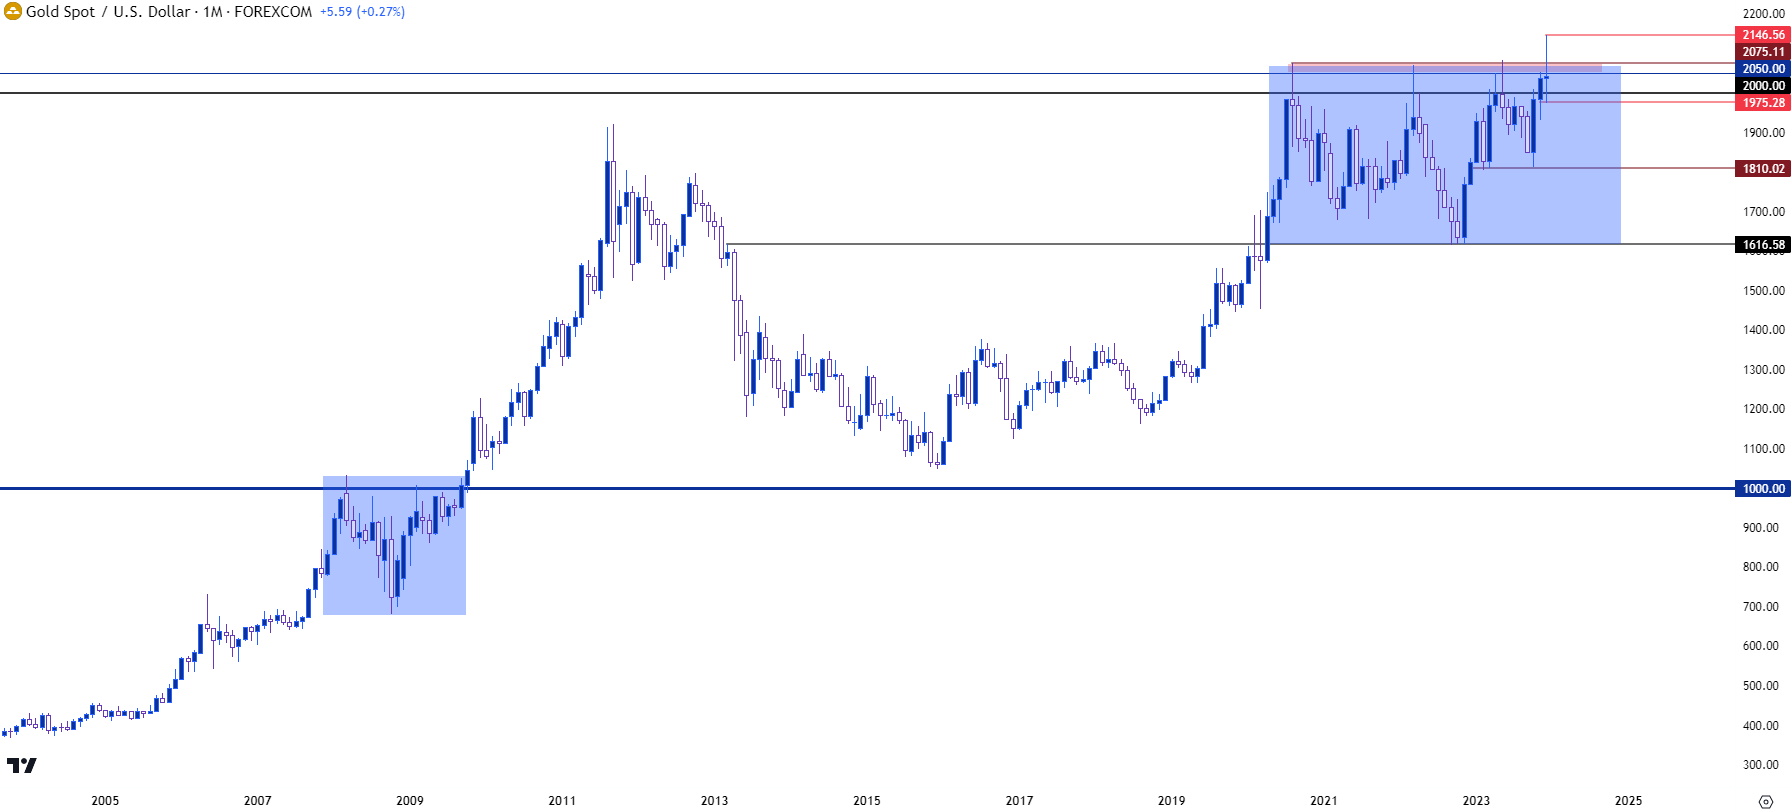 Chart prepared by James Stanley, gold on Tradingview
Gold Strategy for 2024
Gold has now tested above the $2k level on four separate instances since it first came into play in August of 2020. The next test ironically happened just before rate hikes started in March of 2022, but this was helped along by another war bid as Russia invaded Ukraine.
The third test happened when banking stress showed up in the US in March, and along with it came the expectation that the Fed wouldn’t hike regional banks into a disastrous scenario. But it was as the Fed started talking up the prospect of more rate hikes that gold began to turn-lower again, and that five-month theme ran quite clearly, all the way until that deep oversold condition appeared which led to the slingshot breakout move and, ultimately, the fourth trip above the $2k marker.
An increasing frequency of tests at the big figure indicate growing acceptance of that price and when coupled with the higher-lows that have shown, particularly the most recent item in December, and bulls retain control and can push for that breakout theme.
There is risk, however, as the Fed may not yet be ready to cut until later in 2024 and the $2050-$2075 area on the chart has been painful for bulls.
But perhaps more to the point, gold prices have been ranging for three and a half years; and if we do get that sustained break/bullish continuation theme, gold bulls might finally get some longer-term trend potential to work with at some point in 2024. But hoping for that to happen in March could be a bit aggressive with Core CPI still at 4%. So this may be a later-in-the-year type of thing, but remains relevant as we move into the New Year with an election scheduled for November.
Gold Weekly Price Chart
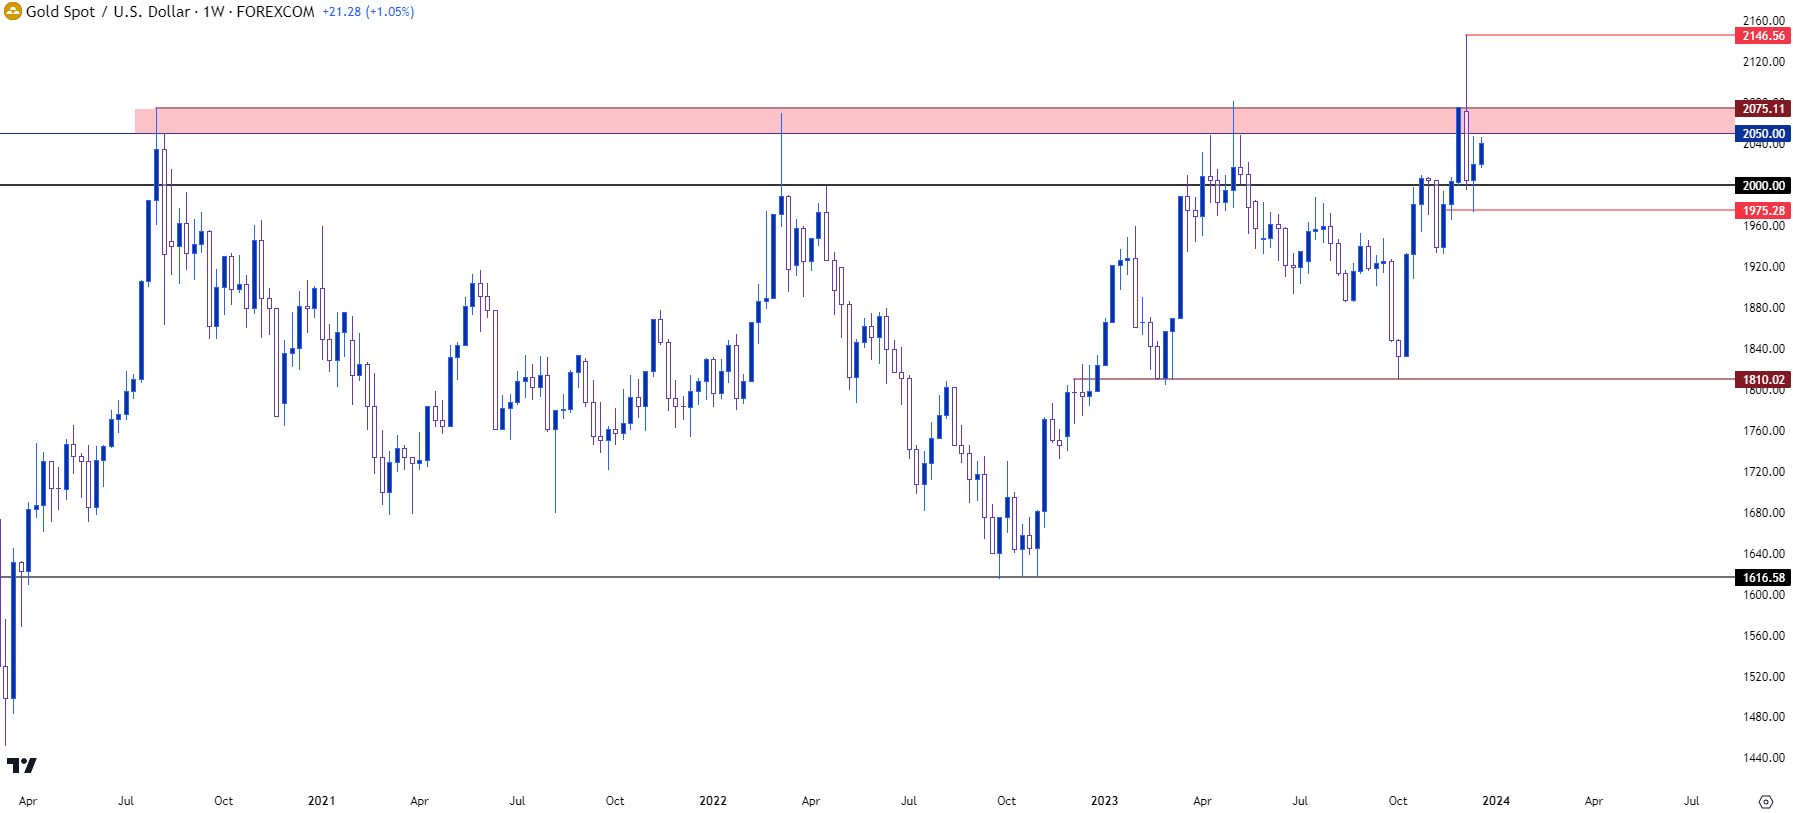 Chart prepared by James Stanley, Gold on Tradingview
--- written by James Stanley, Senior Strategist
Latest market news
Yesterday 01:32 PM
Yesterday 09:35 AM
Yesterday 07:23 AM
Yesterday 04:48 AM
Yesterday 12:17 AM
July 25, 2024 10:39 PM
Latest Gold articles

July 22, 2024 02:47 AM

July 15, 2024 01:00 AM

July 9, 2024 02:32 AM

July 4, 2024 02:30 PM