


Gold, XAU/USD Talking Points:
- Gold has been in a massive run going back to early-October, around the time the Fed started to get more dovish which has helped to punish the USD while driving stocks and commodities, gold included, to fresh highs.
- Gold came into the past week with nine straight days of gains, but finally found some resistance inside of the $2,200 level. That resistance held throughout the week with a series of lower-highs printing, producing a descending triangle formation.
- Given the pace of the rally and the area on the chart that we’re at, a pullback would make sense, especially considering the FOMC rate decision on Wednesday as some trend traders might want to take profit ahead of the event. After that, however, is a giant question mark as a dovish Fed could further propel the trend. It just really depends on how dovish they want to get next week and given the data, there appears to be some flexibility for their messaging in the Summary of Economic Projections.

It was a rather quiet week for gold, all factors considered. And that’s out of the norm for the way the metal has behaved over the past five months.
In early-October gold had moved down to extreme oversold levels, the likes of which rarely show. But what started as a minor pullback on the morning of Non-farm Payrolls that month soon saw prices jump-higher on the back of increasing tension in the Middle East. That led into the softening around the Fed concerning possible rate hikes in the rest of 2023, and as inflation continued to soften, further reinforcing the hope that hikes were done and the next move would be a cut, gold bulls drove back above the $2k level and didn’t really look back for a few months.
You’ll notice on the below chart that after the late-November breakout above $2,000, there hasn’t yet been a weekly close below that level, even with a couple of different support tests. That remains a relevant fact given the drivers that will be on display for next week.
Spot Gold (XAU/USD) Weekly Price Chart
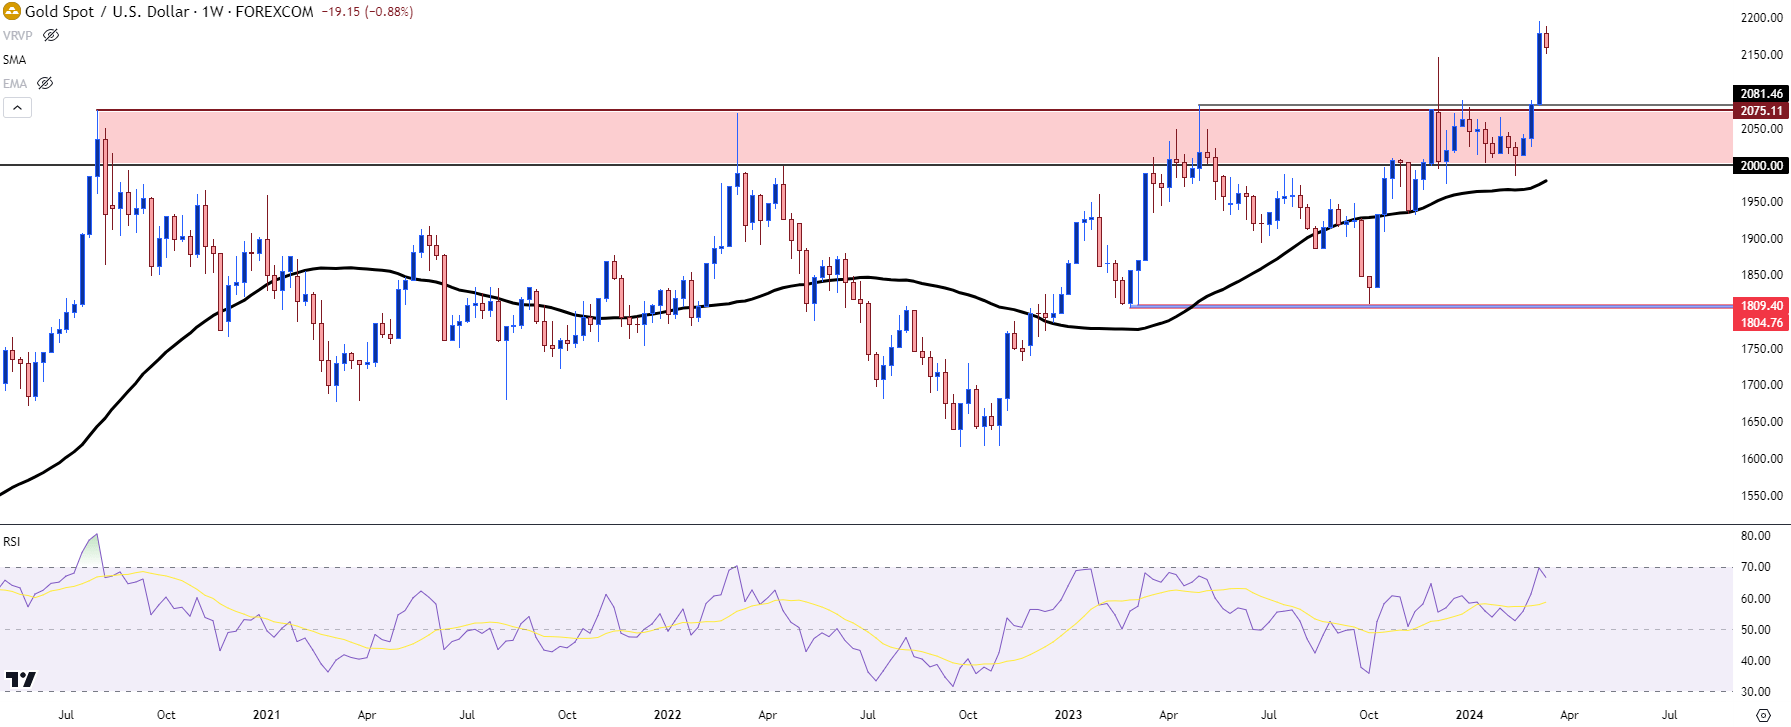 Chart prepared by James Stanley, Gold on Tradingview
Before I get down to the daily and four-hour chart to get closer with near-term strategy, the monthly chart is worth review as it can help to put the importance of current price structure into scope. The zone from $2,000 up to $2,075 has been highly contentious, even going back to the summer of Covid. The Fed’s response to the pandemic helped to propel the yellow metal above $2k for the first time ever: But the move could not hold, and a range built over the next three-and-a-half years.
What’s notable here are the wicks, as we can see several intra-bar reactions on this chart at or around the current zone. So, for bigger picture bullish scenarios, it seems that holding support above that prior resistance, from around $2,000 up to $2,075, would be an important variable. And, also notable is the fact that the $2,075-$2,082 area could be some attractive support potential if it does come into play.
Gold (XAU/USD) Monthly Chart
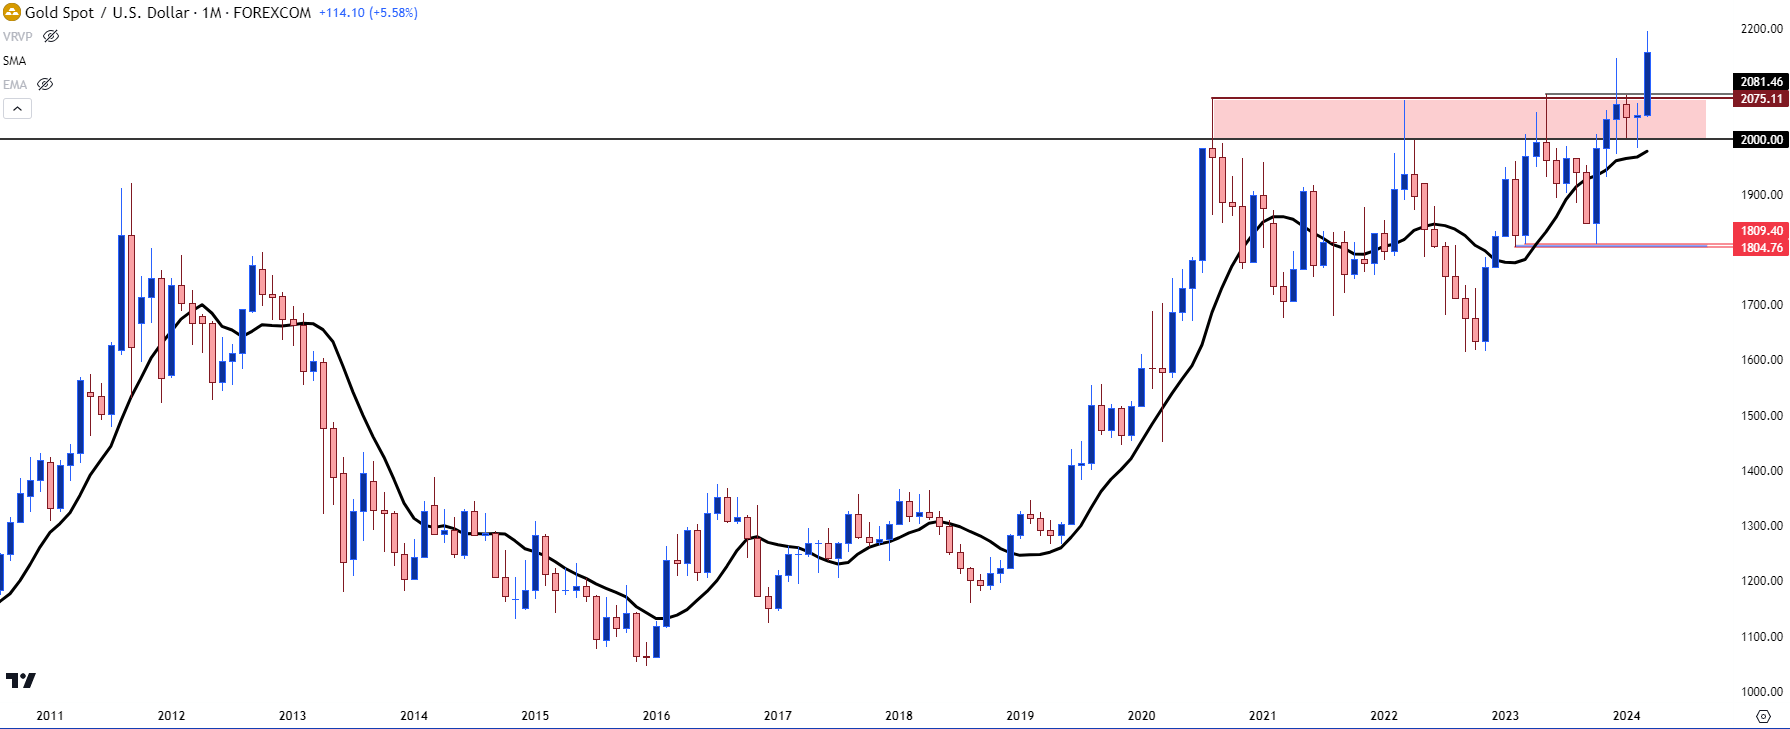 Chart prepared by James Stanley, Gold on Tradingview
On the daily chart, we can see just how loud the recent extension in this breakout has been. Making matters more interesting is what helped to produce it, as it was the CPI report released in February that allowed for the first push below the $2k level in 2024 trade. Price continued to trickle lower for the next 24 hours but a day after that CPI release, a comment from Chicago Fed President Austan Goolsbee made it sound as though the Fed wasn’t too concerned with higher-than-expected inflation, as he said market participants should avoid getting ‘flipped out’ about the inflation print.
As that comment came in, gold built a bullish outside bar on the 2-hour chart and started to run-higher, breaking back-above the $2k level the day after and starting the next leg of the topside move. The Core PCE report released later in the month showed a different take on inflation and that further helped to propel the bullish trend. The more that the Fed talked up the prospect of rate cuts, even with some strength still showing in U.S. data, the more that bulls have pushed, all the way into the fresh all-time-high set around NFP Friday in March.
This week, however, has been all digestion, as price was unable to match that prior high and each day has produced a lower-high, helping to form a descending trendline that sets up a possible descending triangle formation.
Gold Daily Price Chart
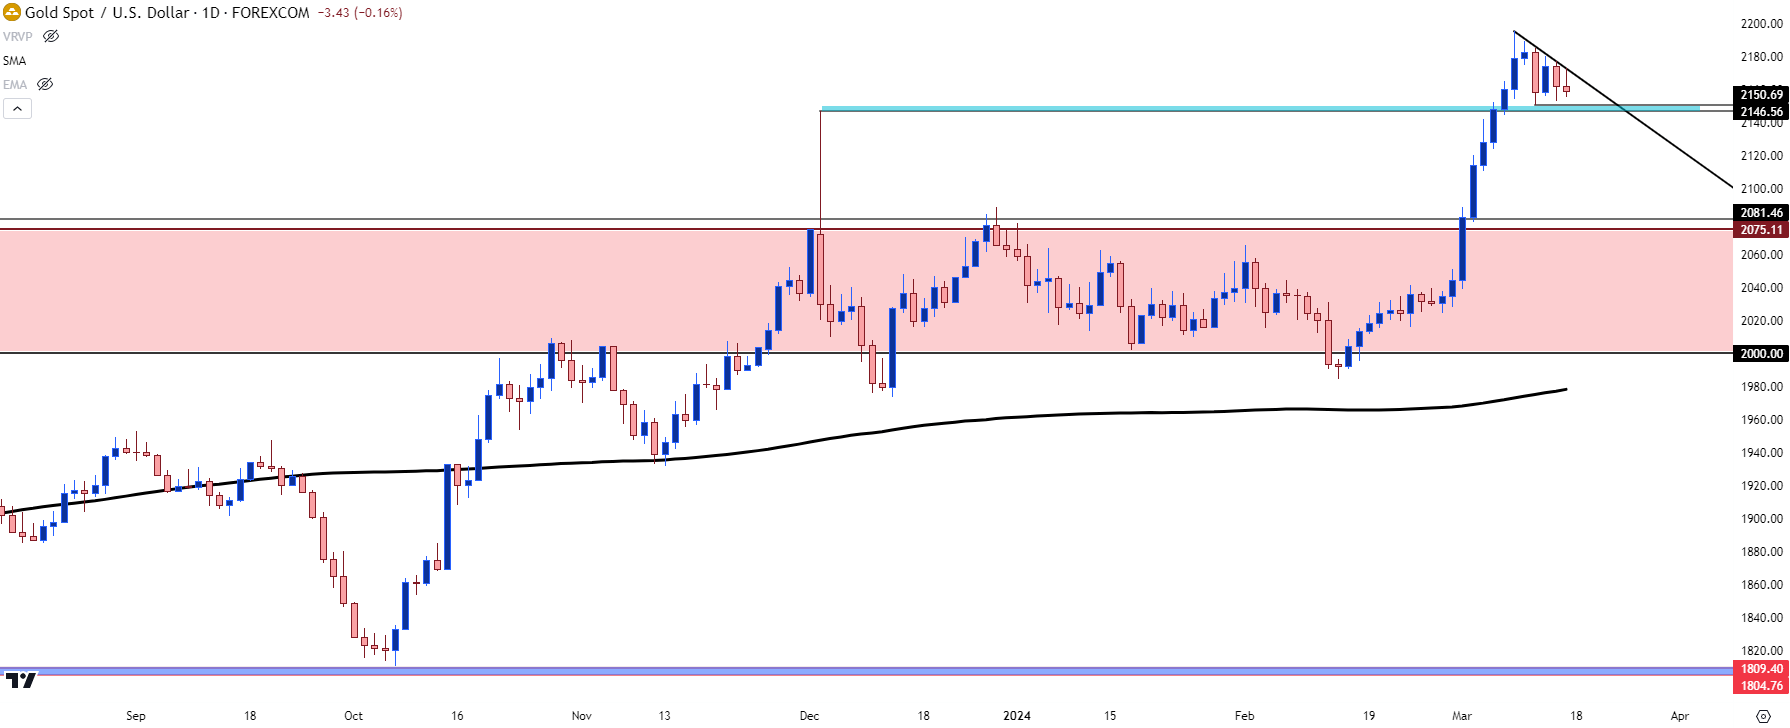 Chart prepared by James Stanley, Gold on Tradingview

Gold Strategy
Given the blistering bullish breakout, there weren’t many pause points or support/resistance inflections along the way, and this could complicate support projection. As noted above, with the number of inflections seen at $2,075 and $2,082 over the past few years then, logically, that could be an area of interest.
But it’s so far away from current price that if we witness a near $100 breakdown in the spot price of gold, we’d have to ask if something else had shifted. But there was a quick swing around $2,130 and then the $2,100 level could be of use as a psychological level.
Perched atop current price is the descending triangle formation, accented by horizontal support bringing diminishing marginal impact to help produce lower-highs. This can keep the door open for a pullback and that’s something that could show ahead of the Fed next week.
But the bigger question to gold trajectory is the Fed, and I think that’ll remain a question until Wednesday afternoon when we get to see the updated projections in the SEP. If the Fed holds the line, expecting three rate cuts this year, we could see bullish motive soon return. But any moves towards ‘less dovish’ could push more motivation for the pullback.
And bigger picture, that $2,075-$2,082 area is a major point of contention. If we get that ‘less dovish’ outcome from the Fed, and the descending triangle has filled, that becomes a spot for possible reversals to play-in.
Spot Gold (XAU/USD) Four-Hour Price Chart
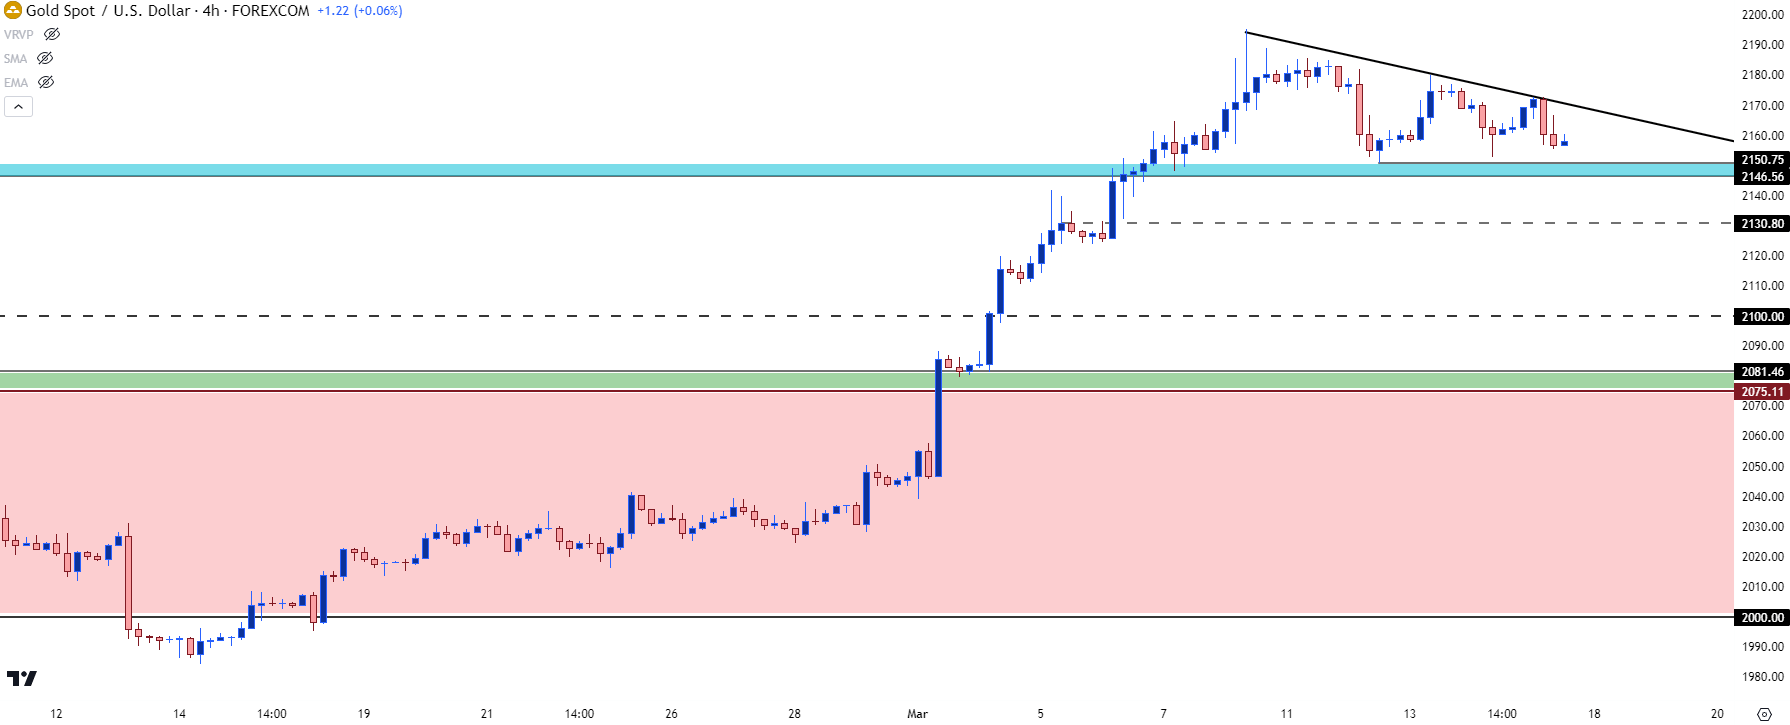 Chart prepared by James Stanley, Gold on Tradingview
--- written by James Stanley, Senior Strategist
Latest market news
April 25, 2024 03:09 PM
April 25, 2024 03:00 PM
Latest Gold articles

April 25, 2024 11:14 AM
April 23, 2024 11:30 AM

April 23, 2024 03:18 AM

April 22, 2024 10:48 PM