


Gold looks to fresh yearly highs ahead of PPI, jobless claims data
- Gold rises after US CPI data, FOMC minutes
- US PPI, jobless claims are due
- Gold looks to test resistance at $2032 to bring $2050 into play.
Gold is rising for a third straight day but failed to retest the yearly high of $2032 overnight as the US dollar weakened following the March US CPI data and the release of the minutes from the FOMC meeting.
US headline CPI cooled by more than expected to 5% YoY, down from 6% and below forecasts of 5.2%. Core inflation rose to 5.6% in line with forecasts and up from 5.5%.
Meanwhile, the minutes of the March Fed meeting highlighted the Fed’s concerns over a recession and showed policymakers retreating from the previously firmly hawkish stance.
While the market is still pricing in a 65% probability of a rate hike in May, expectations are growing that the Fed is close to the end of its rate hiking cycle.
A combination of rising expectations of a dovish Fed pivot, recession fears, and a weaker USD are lifting Gold and could help the precious metal reach a fresh yearly high.
Looking ahead US PPI data is expected to cool to 3% YoY from 4.6% and jobless claims are expected to rise further to 232k, up from 228k as weakness continues to seep into the labour market.
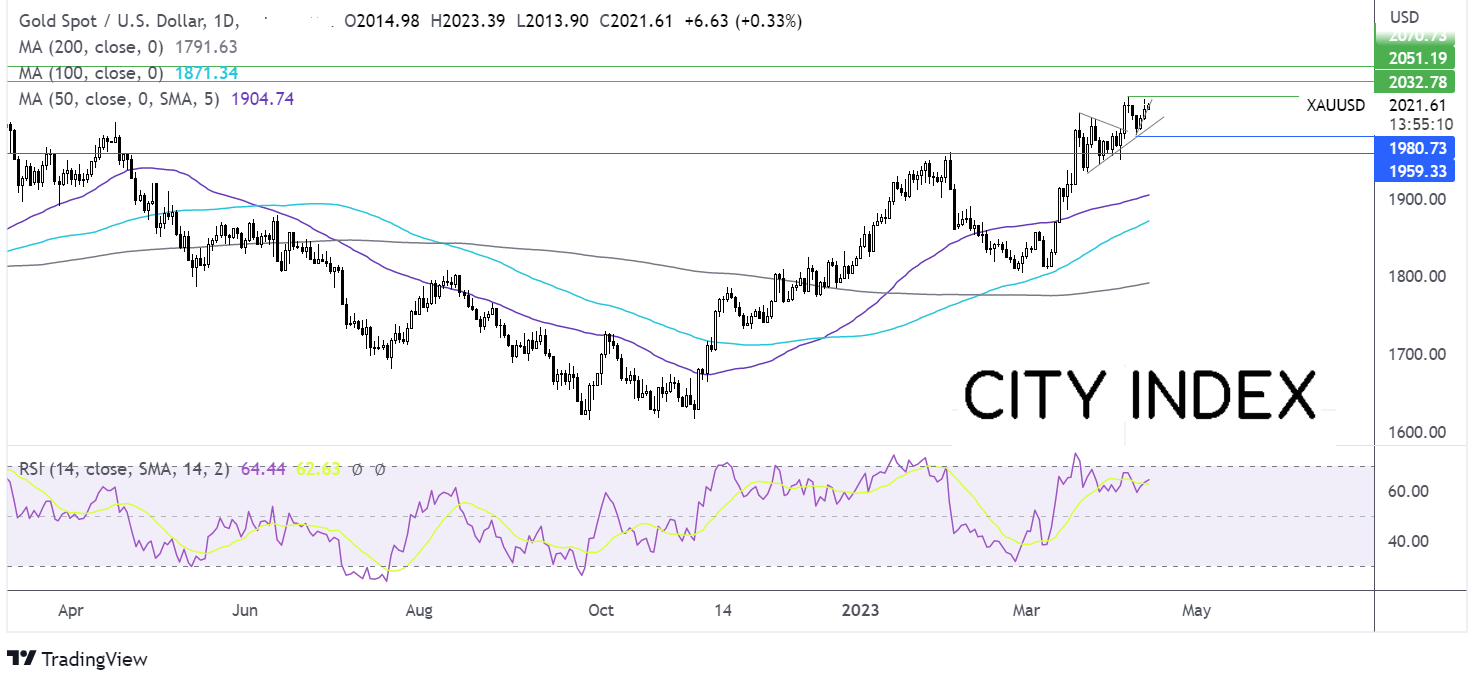
Where next for Gold price?
Gold is rising for a third day but needs to gain acceptance above $2020, to test the yearly high of 2032. A break above here opens the door to 2050 the round number and 2070 the all-time high.
The RSI above 50 supports further upside, while it remains out oof overbought territory.
On the downside, immediate support can be seen at $2001/$2000, yesterday’s low and the psychological level ahead of $1981 the weekly low.
GBP/USD rises despite UK GDP stalling in February
- UK GDP 0% in February MoM
- BoE’s Bailey played down banking crisis risk
- GBP/USD looks to test 1.2525
GBP/USD is rising for a third straight day after aftercooling US headline inflation and as UK economic growth stalls in February.
UK GDP was 0% MoM in February, after an upwardly revised 0.4% in January. Services output fell 0.1%, production fell 0.2% and construction output grew 2.4%. This follows from an upwardly revised 0.4% growth in January.
While the UK economy has avoided a recession for now, but the figures are far from inspiring. With the extra bank holidays and health sector strikes activity could slow in Q2. The IMF forecast the UK economy contracting 0.3% in 2023.
While growth has stalled, inflation remains in double digits. BoE’s Andrew Bailey yesterday played down the risk of a system-wide banking crisis, paving the way for further rate increases.
Meanwhile, the USD has steadied after steep losses yesterday following cooler headline inflation and after the minutes to the March FOMC meeting fueled recession fears.
US PPI and jobless claims are due later.
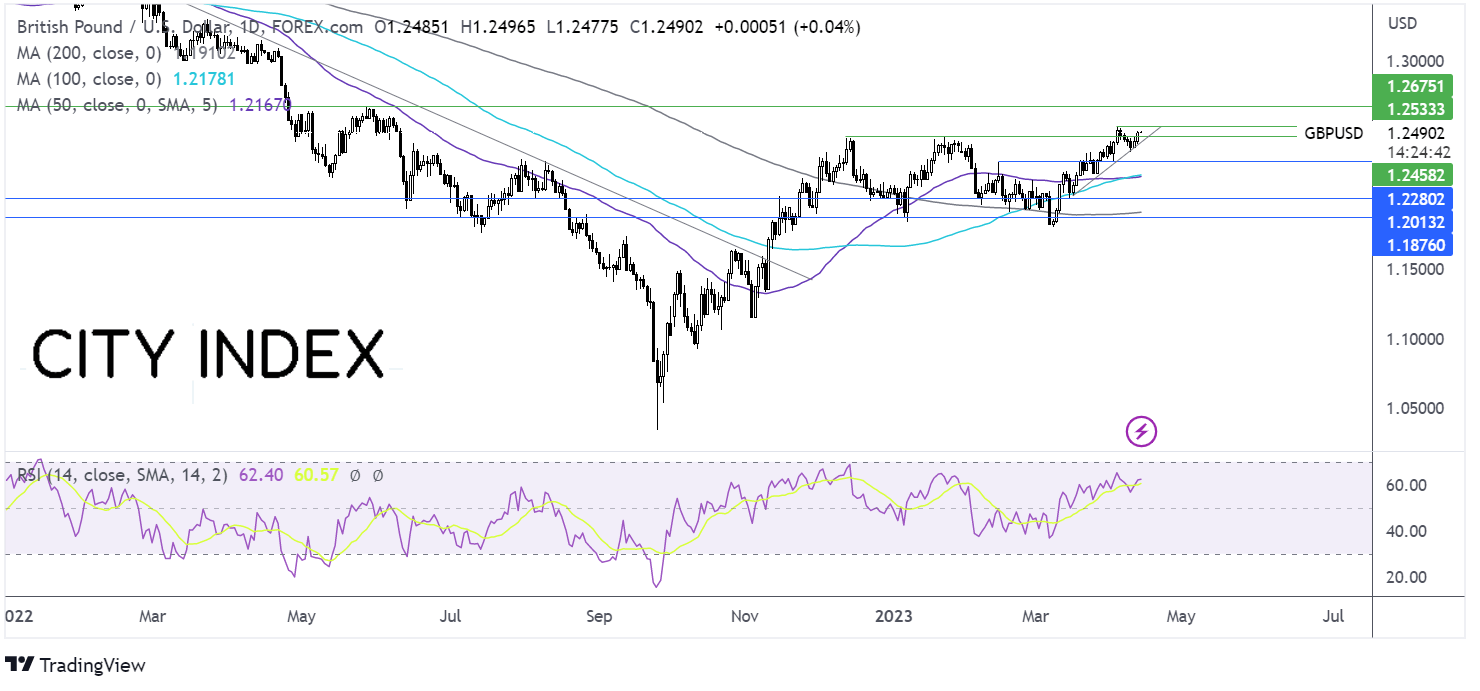
Where next for GBP/USD?
GBP/USD rebounded from 1.1840 the March low, pushing above 200, 100 & 50 sma. GBP/USD trades above the rising trendline dating back to mid-March.
A break above 1.2450 resistance, combined with the bullish RSI is paving the way for the pair to test 1.2525 the 2023 high. Beyond here 1.2665 the May high comes into focus.
Sellers will look for a close below 1.2450 and a break below 1.2270 to negate the near term uptrend.
Latest market news
Yesterday 01:32 PM
Yesterday 09:35 AM
Yesterday 07:23 AM
Yesterday 04:48 AM
Yesterday 12:17 AM
July 25, 2024 10:39 PM
Latest Trade Ideas articles

Yesterday 09:35 AM

Yesterday 12:17 AM

July 25, 2024 10:39 PM

July 25, 2024 05:30 PM