


- Gold and silver analysis: Metals rally on hopes Fed may cut rates sooner in 2024
- US CPI cooled to 3.2% YoY in October from 3.7% in the previous month
- Silver technical analysis: three-bar reversal pattern in the making
Welcome to another edition of Technical Tuesday. In this edition, we will analysis gold and silver following a weaker US inflation report that sent financial markets surging.
US inflation turned out to be weaker than expected on both the headline and core fronts, and the market’s response was a swift one. We saw gold and silver rise, as yields and the dollar dropped, while index futures jumped with the pace of the rally gaining further momentum once the cash markets opened on Wall Street. Investors are hopeful that the slowdown in US inflation has much more to go as higher borrowing costs increasingly weigh on economic activity and housing rents slow further down in the coming months.
Gold and silver analysis: Metals rally on hopes Fed may cut rates sooner in 2024
It wasn’t just gold and silver that rallied in reaction to the weaker inflation report. At the time of writing, the GBP/USD was up a massive 210 pips on the day near 1.25 handle, while both the kiwi and Aussie were up almost 2% each versus the dollar. The big reaction in the market suggests that investors have become perhaps significantly more hopeful that interest rates will start to go down from here, possibly starting by around the middle of next year as the Fed is starting to win the inflation fight. US CPI cooled to 3.2% YoY in October from 3.7% in the previous month, while core inflation eased to 4%.
While it looks like the dollar may have peaked, the trouble for the dollar bears is that outside of the US, the global economy is struggling, which means that foreign currencies are not significantly more appealing than the dollar at this stage. Still, traders have less reason to continue buying the dips in the dollar now that we have further evidence that inflation is on a downward spiral. Gold and silver stand ready to benefit if yields descend further moving forward.
Before discussing the macro factoring influencing gold and silver prices further, let’s have a quick look at the charts of gold and silver first…
Silver technical analysis
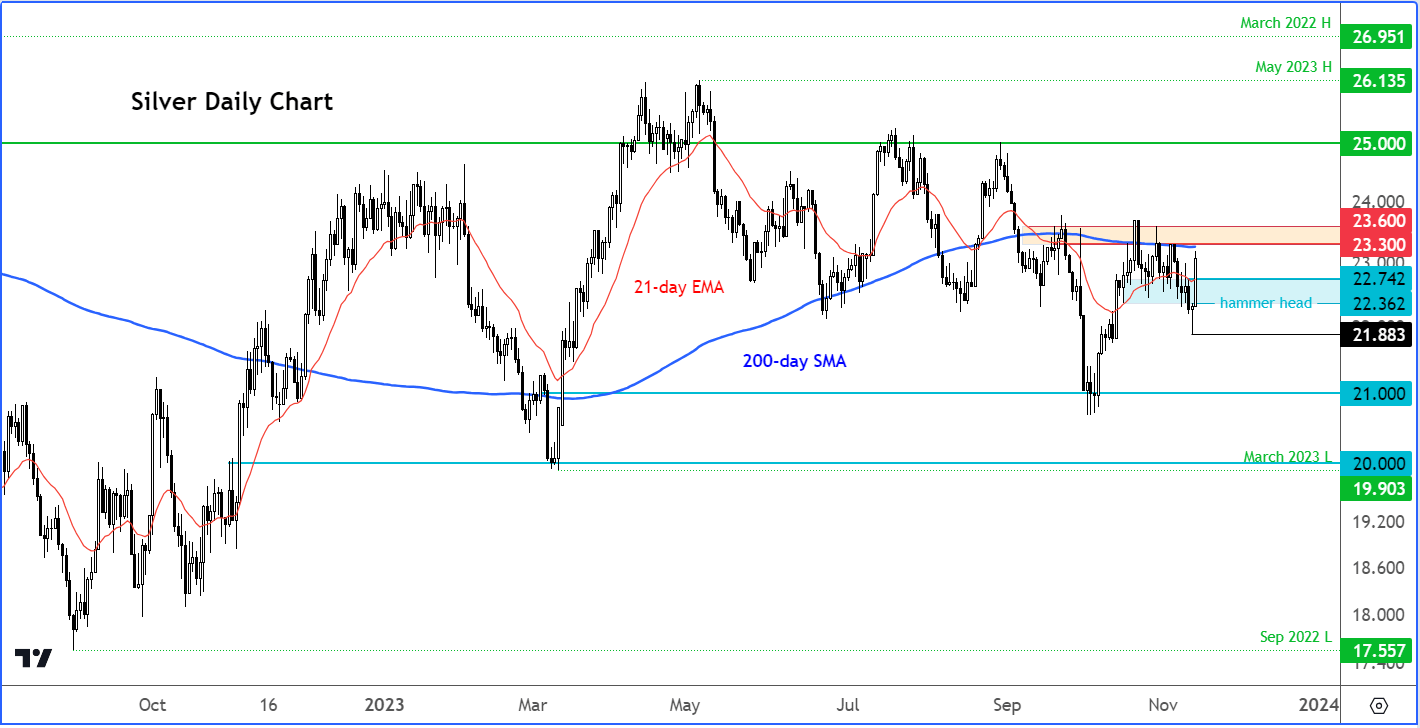
Following the formation of a hammer candle on Monday, the sharp upside follow-through today means silver has formed a three-bar bullish reversal pattern on its daily time frame. But with this potential reversal pattern being formed underneath prior resistance area in the zone between $23.30 to $23.60, where we also have the 200-day moving average coming into play, the bulls may proceed with extra caution until we get a more decisive breakout. Nevertheless, further upside continuation looks the more likely outcome than a sell-off, judging by today’s bullish price action.
Gold technical analysis
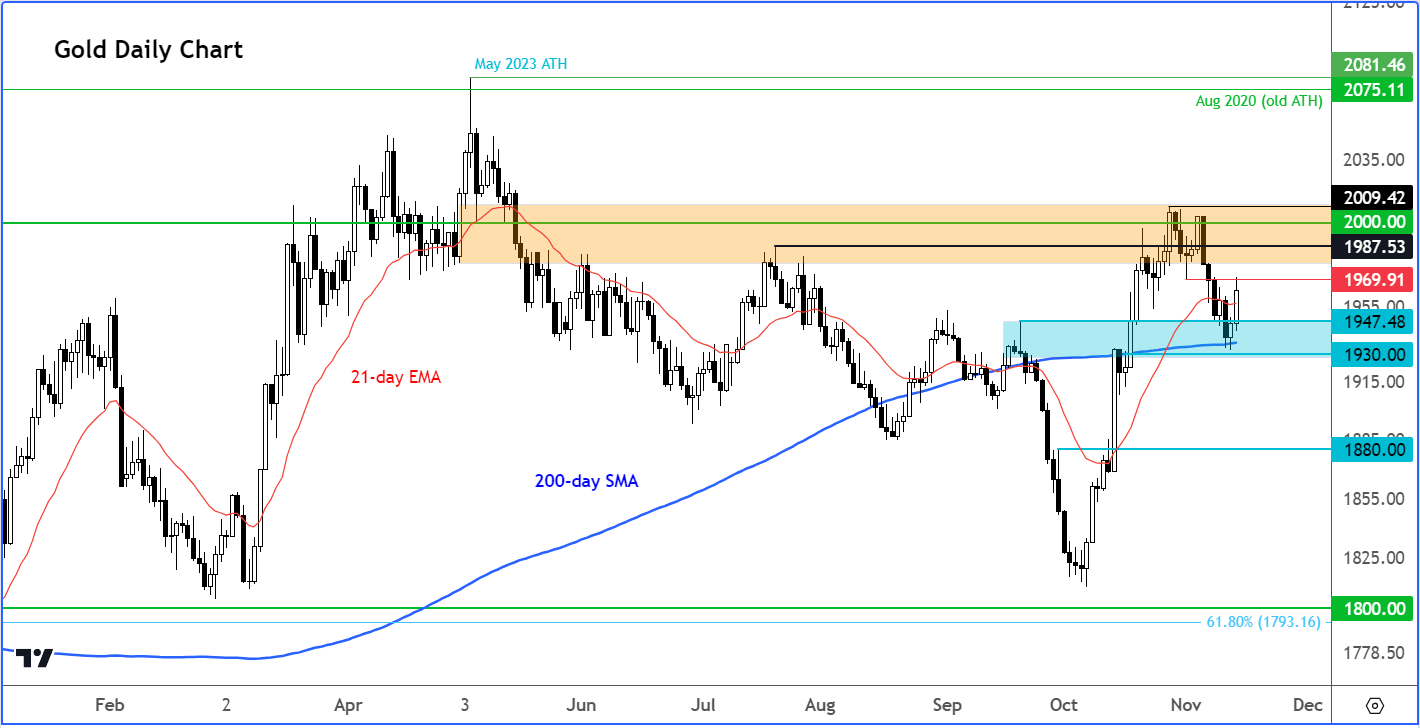
Today’s recovery from a key support area around $1930-$1940 could be a sign of a bullish reversal for gold. Let’s see if the precious metal will be able to kick on from here.
As per the highlighted region on my chart, gold has managed to hold above a pivotal area between $1931 and $1947. This particular price range had previously exhibited a tendency to act as resistance during multiple instances observed between the months of August and September.
Following the recent breakthrough above this critical range, the bulls would have felt it was imperative for gold to find renewed buying momentum from within this specific zone. Now that we have seen some signs of strength here, we may see a renewed push towards $2000 again. So far, however, interim resistance at $1969/70 was proving a tough nut to crack.
For gold bears, more bearish price action is needed before coming into the fray. Adding further significance to the above $1930-$1940 range is the 200-day average, which also comes into play here. Therefore, a potential breach below that area, especially if sustained on a daily closing basis, would signify a bearish turn of events, warranting a vigilant assessment of the market's trajectory for the bulls. But we will cross that bridge if and when we get there. For now, the bulls are holding their ground.
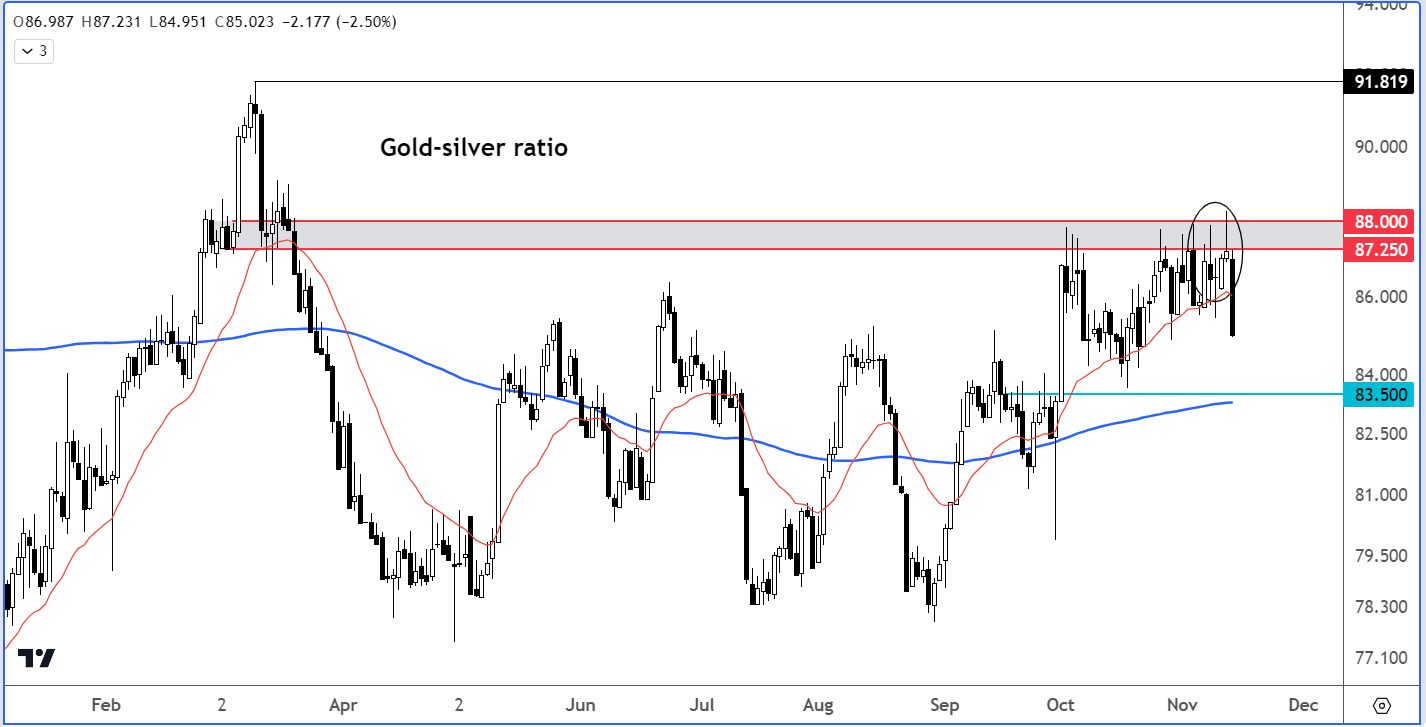
In my opinion, silver exhibits greater potential for further upside compared to gold at this juncture, given the fact that the gold-silver ratio has now reached and reacted from a key resistance zone circa 88.00:
Peak interest rates narrative could get louder on evidence of more data misses
The louder the “peak interest rates” narrative gets, the more support we are likely to see for gold and silver prices. Until today’s bullish-looking price action, the start of the month of November had been frustrating for precious metals bulls. Gold and silver have both struggled to hold onto any gains, following gold's notable 7% increase in October and silver's comparatively modest 3% rise. Gold's upward trajectory last month was primarily attributed to the surge in demand for safe-haven assets, prompted by the escalation of the Middle East conflict, leading investors to shift away from riskier investments. Despite a surge in US bond yields to their highest point since 2007, gold managed to rally. However, although bond yields have since sharply decreased at the beginning of this month, this has not yet positively impacted gold prices, until this week. On the evidence of price action over the past couple of days, the inverse relationship between gold and yields are back.
Upcoming Chinese data could impact gold and silver prices
It is also important to monitor economic indicators from China, the world’s largest gold consumer. As well as industrial production we will have retail sales data to look forward to in the early hours of Wednesday from the world’s second largest economy. Recent Chinese macro pointers have shown some improvement. We will need to see more evidence of a turnaround for yuan and local stocks to recover more meaningfully. Gold, silver and copper should also benefit from any positive surprise in Chinese data.
Video: Gold and silver analysis
Source for all charts used in this article: TradingView.com
-- Content created by Fawad Razaqzada, Market Analyst
Follow Fawad on Twitter @Trader_F_R
How to trade with City Index
You can trade with City Index by following these four easy steps:
-
Open an account, or log in if you’re already a customer
• Open an account in the UK
• Open an account in Australia
• Open an account in Singapore
- Search for the company you want to trade in our award-winning platform
- Choose your position and size, and your stop and limit levels
- Place the trade
Latest market news
Today 01:39 PM
Today 11:05 AM
Today 10:46 AM
Latest Gold articles

Today 11:05 AM


April 25, 2024 11:14 AM
April 23, 2024 11:30 AM