


Asian Indices:
- Australia's ASX 200 index fell by -9.6 points (-0.13%) and currently trades at 7,138.50
- Japan's Nikkei 225 index has risen by 231.81 points (0.74%) and currently trades at 31,682.57
- Hong Kong's Hang Seng index has fallen by -247.77 points (-1.38%) and currently trades at 17,703.08
- China's A50 Index has fallen by -59.54 points (-0.47%) and currently trades at 12,516.17
UK and Europe:
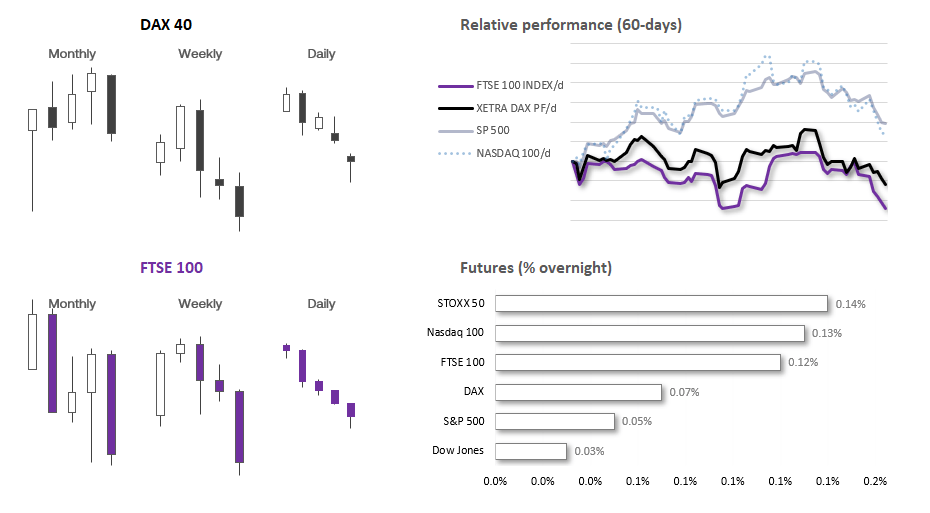
- UK's FTSE 100 futures are currently up 7 points (0.1%), the cash market is currently estimated to open at 7,269.43
- Euro STOXX 50 futures are currently up 5 points (0.12%), the cash market is currently estimated to open at 4,217.95
- Germany's DAX futures are currently up 11 points (0.07%), the cash market is currently estimated to open at 15,585.26
US Futures:
- DJI futures are currently up 6 points (0.02%)
- S&P 500 futures are currently up 1.5 points (0.03%)
- Nasdaq 100 futures are currently up 18 points (0.12%)
- The PBOC (People’s Bank of China) surprised analysts by not cutting their 5-year loan prime rate, but cut the 1-year LPR by -15bp. The 5-year is the benchmark rate for mortgages, and the consensus for a -15bp but was based on the assumption that China would want to support the property sector
- The China A50 fell to 12,400 before regaining its footing, USD/CNH rose to a 2-day high
- The FTSE 100 fell for a sixth consecutive days on Friday, although it held above its YTD low of 7206.82
- Index futures markets for Europe and the US are pointing slightly higher, which suggests the bleeding form last week has at least slowed (if not stopped).
- We see the potential for cautious gains today, as part of a technical correction if nothing else.
- Gold held above Friday’s 5-month low, although bullish momentum is sorely lacking. 1900 is a likely resistance level and just $7 higher from current levels, which could make it at pivotal level for today’s session
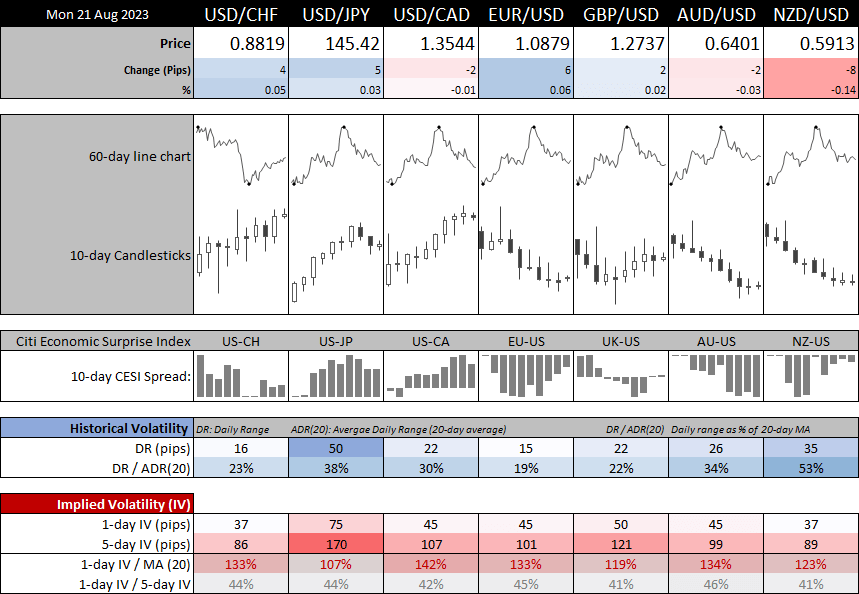
1-day implied volatility is above its 20-day average for all forex majors, despite no top tier economic data scheduled over the next 24 hours. Perhaps it is a combination of sub-par easing from the PBOC along with the upcoming BRICS summit and Jackson Hole symposium. But the 1-day IVs are not excessively over their average either.
We can see that ranges were very quiet during the Asian session, with NZD only moving around half of its usual range and USD/JPY below 40%.
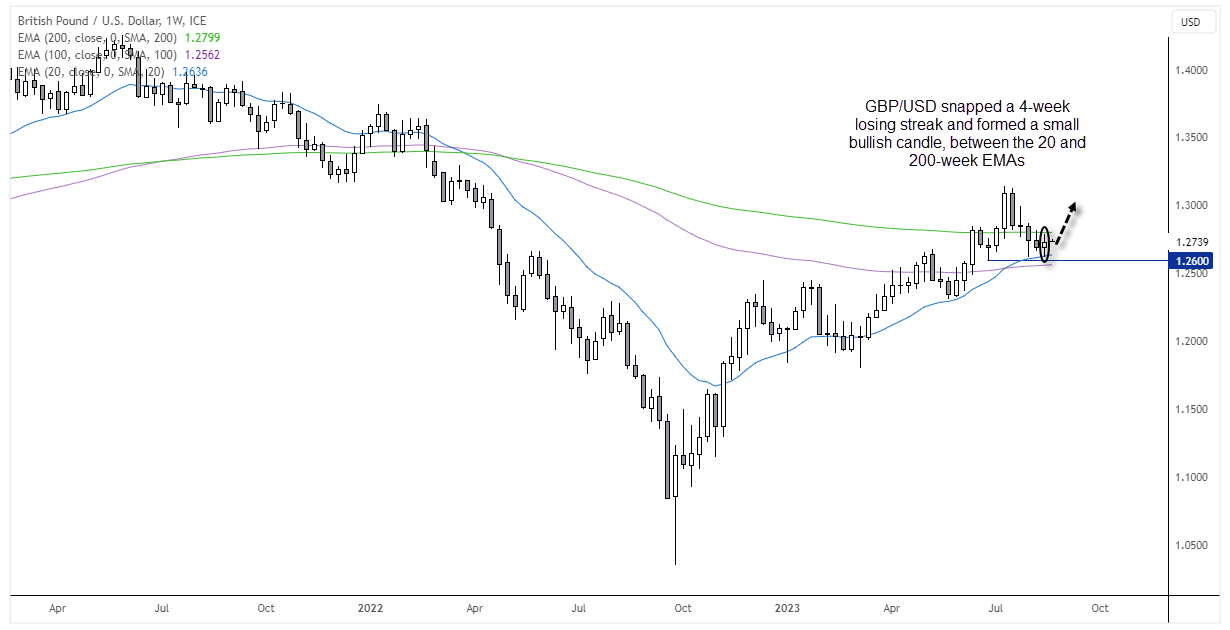
GBP/USD technical analysis (weekly chart):
GBP/USD has delivered a textbook bullish trend on the weekly chart, since its infamous low in September 2022 due to Liz Truss’s disastrous budget plans. The 20-week EMA has provided dynamic support along the way, and came to the rescue once again at last week’s low. A small bullish candle also formed (Doji) to snap its 4-week losing streak. Perhaps e are at or near an inflection point and GBP/USD could turn higher over the coming week/s, although take note that the 200-ay EMA sits around 1.28, making it a likely level of resistance at least over the near term.
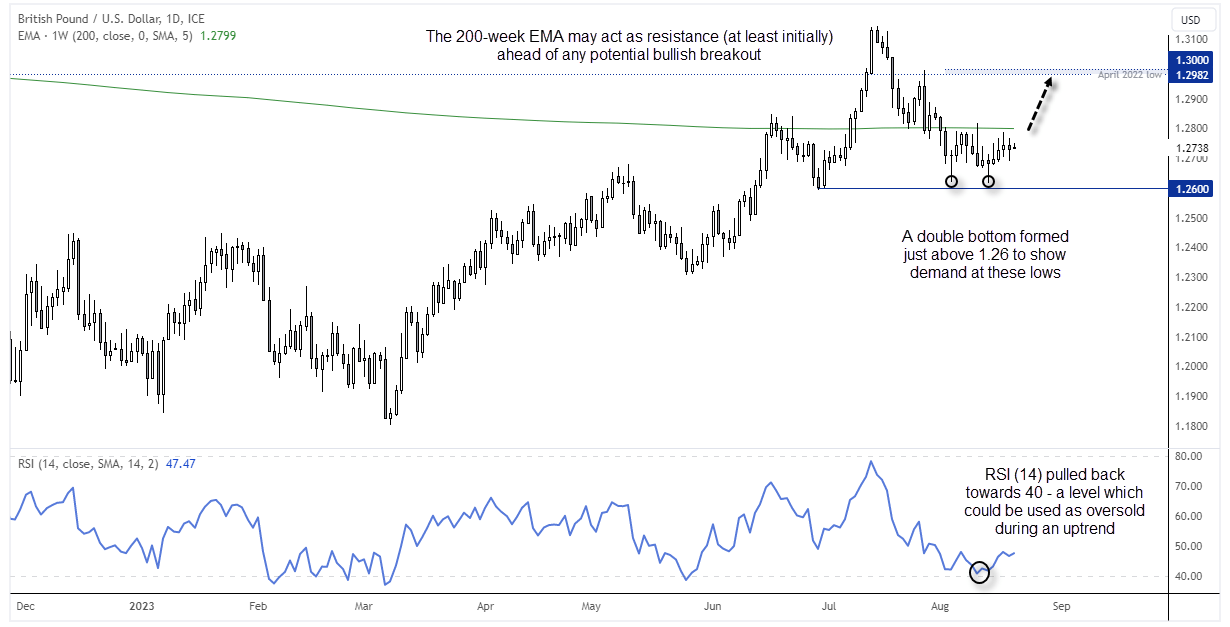
GBP/USD technical analysis (daily chart):
The daily chart shows that GBP/UD formed a double bottom just above 1.2600 with two bullish pinbars, which suggests strong demand above that key level. RSI (14) is holding above 40, a level which could be considered as oversold during a uptrend. Prices rallied for three days up to Thursday before retreating on Friday, but overall it looks like prices are trying to form a base ahead of a break back above the 200-day week EMA.
Given the Jackson Hole symposium awaits on Friday, we may find moves to be limited. But if Jerome Powell hints that the Fed are indeed done with hiking for now, it could weigh on the US dollar and help GBP/USD break higher. If so, a move back to 1.3000 seems achievable.
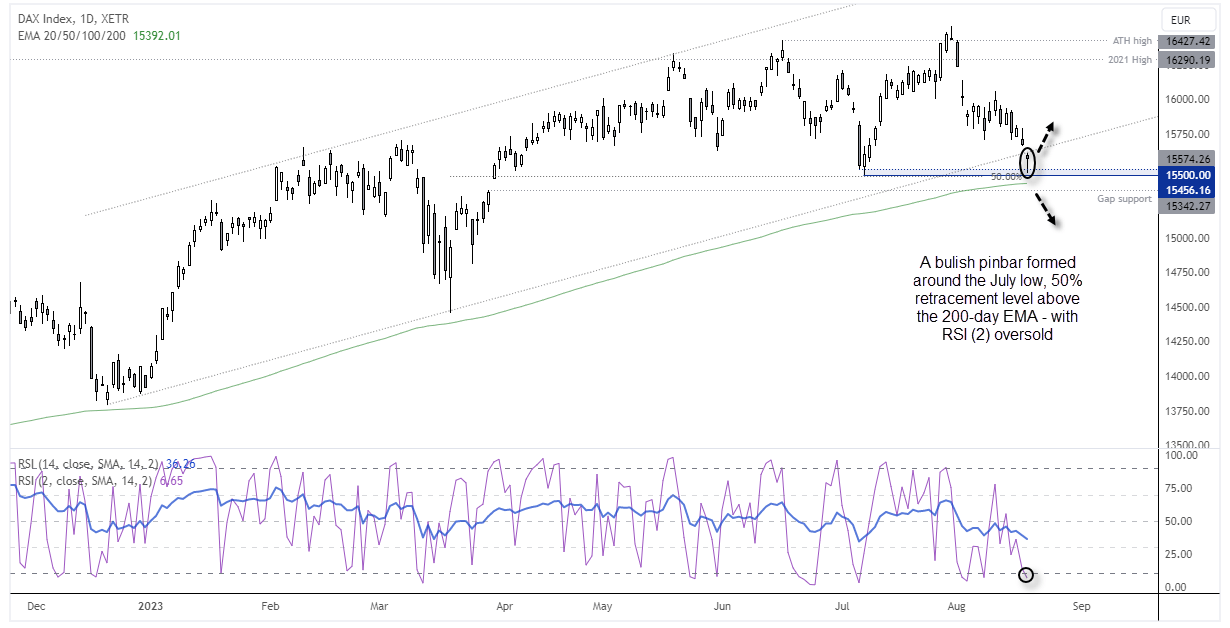
DAX technical analysis (daily chart)
The DAX wasted no time in getting dragged lower with negative sentiment on Friday, which saw the German bourse break beneath the lower trendline of its bullish channel. However, given the market help above a key support zone, it does leave the potential for a bounce (at least over the near-term).
Friday’s candle was a bullish pinbar just above the July low and 50% retracement level, just above the 200-day EMA. RSI (2) also reached oversold on Friday, and index future point to a firmer open today, following a stronger lead from Wall Street om Friday. Whilst prices remain above last week’s low, the bias is for a bounce to 15,750 – a break above which brings 16,000 back into focus.
View the full economic calendar
-- Written by Matt Simpson
Follow Matt on Twitter @cLeverEdge
How to trade with City Index
You can trade with City Index by following these four easy steps:
-
Open an account, or log in if you’re already a customer
• Open an account in the UK
• Open an account in Australia
• Open an account in Singapore
- Search for the market you want to trade in our award-winning platform
- Choose your position and size, and your stop and limit levels
- Place the trade
Latest market news
Yesterday 01:32 PM
Yesterday 09:35 AM
Yesterday 07:23 AM
Yesterday 04:48 AM
Yesterday 12:17 AM
July 25, 2024 10:39 PM
Latest Trade Ideas articles

Yesterday 09:35 AM

Yesterday 12:17 AM

July 25, 2024 10:39 PM

July 25, 2024 05:30 PM