


Asian Indices:
- Australia's ASX 200 index rose by 15.9 points (0.23%) and currently trades at 7,011.30
- Japan's Nikkei 225 index has risen by 343.46 points (1.07%) and currently trades at 3,259.94
- Hong Kong's Hang Seng index has fallen by -54.65 points (-0.31%) and currently trades at 17,513.81
- China's A50 Index has risen by 3.36 points (0.03%) and currently trades at 12,133.35
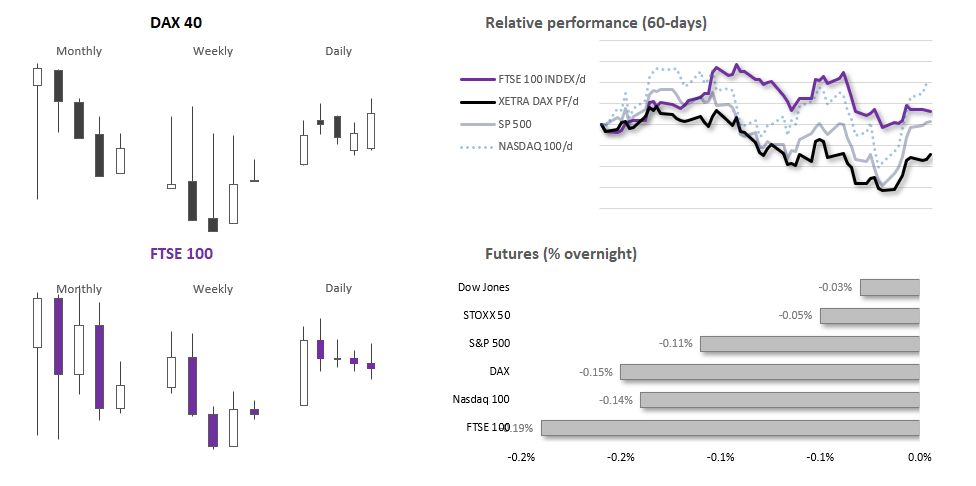
UK and Europe:
- UK's FTSE 100 futures are currently down -12.5 points (-0.17%), the cash market is currently estimated to open at 7,389.22
- Euro STOXX 50 futures are currently down -3 points (-0.07%), the cash market is currently estimated to open at 4,175.49
- Germany's DAX futures are currently down -23 points (-0.15%), the cash market is currently estimated to open at 15,206.60
US Futures:
- DJI futures are currently down -10 points (-0.03%)
- S&P 500 futures are currently down -4.5 points (-0.1%)
- Nasdaq 100 futures are currently down -21 points (-0.14%)
Events in focus (GMT):
- 08:30 – BOE MPC member Pill speaks
- 13:30 – Fed Chair Powell speaks
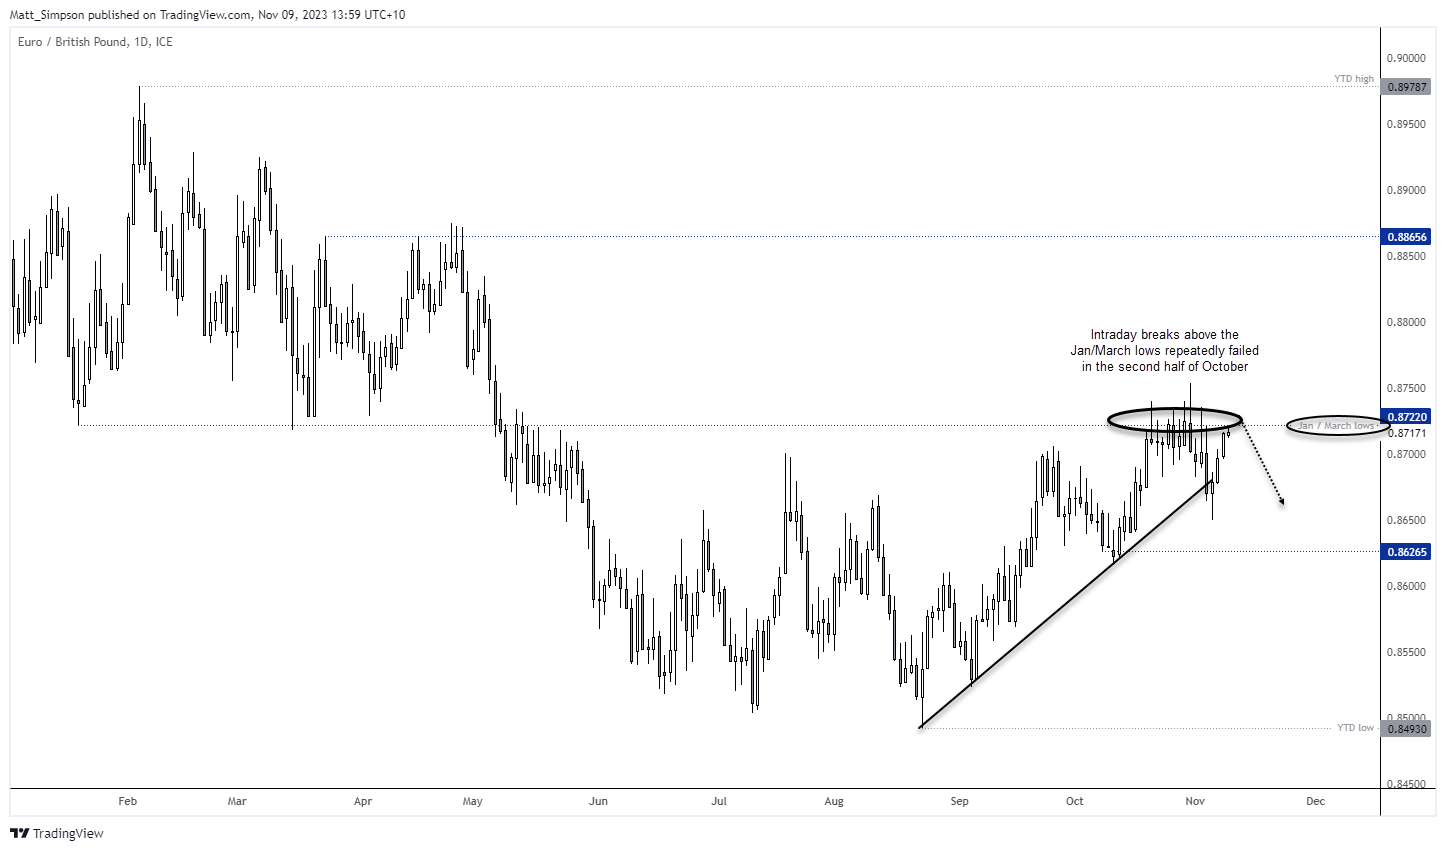
EUR/GBP technical analysis (daily chart):
The daily timeframe for EUR/GBP shows a clear uptrend, but does that make long positions the higher probability trade? Around current levels, I’d argue not. Sure, we’ve seen a strong 3-day rally and Asian trade has seen it rise for a fourth, but it is worth noting that EUR/GBP saw a lot of volatility around current in the second half of October, which saw several false breaks above the January and March lows before closing the day around or beneath them. And that resulted in a pullback.
EUR/GBP may not be the easiest of pairs to trade, but I am suspicious of any intraday breaks above the Jan / March lows. So if momentum shows signs of waning near the cycle highs, it may be a pair to consider for a cheeky short.
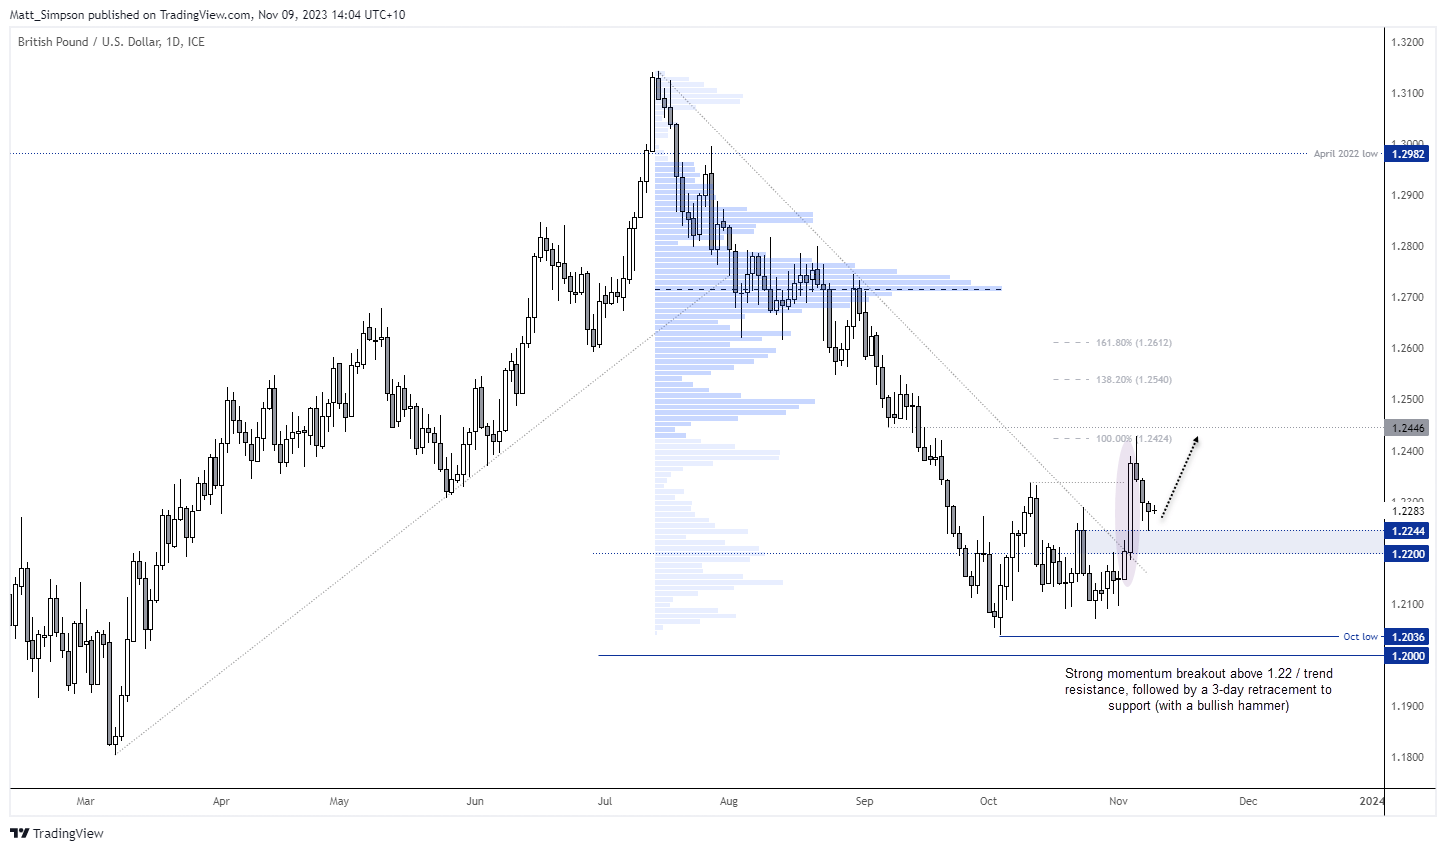
GBP/USD technical analysis (daily chart):
Yesterday I mentioned that I was seeking evidence of a swing low on the GBP/USD daily chart. I suspect we may now have it. The 3-day retracement only spans around half of the strong bullish breakout above 1.22 and trend resistance, and the third day was a bullish hammer. The hammer’s low also found support at the close highs of the prior cycle high, which is why suspect we have reached or are very close to an inflection point.
Bulls could seek a break above Wednesday’s high to assume bullish continuation or, if confident the low is near, seek to enter long within yesterday’s range with a stop somewhere beneath the cycle lows (a wider stop could allow greater levels of intraday volatility).
View the full economic calendar
-- Written by Matt Simpson
Follow Matt on Twitter @cLeverEdge
How to trade with City Index
You can trade with City Index by following these four easy steps:
-
Open an account, or log in if you’re already a customer
• Open an account in the UK
• Open an account in Australia
• Open an account in Singapore
- Search for the market you want to trade in our award-winning platform
- Choose your position and size, and your stop and limit levels
- Place the trade
Latest market news
Yesterday 01:32 PM
Yesterday 09:35 AM
Yesterday 07:23 AM
Yesterday 04:48 AM
Yesterday 12:17 AM
July 25, 2024 10:39 PM
Latest Trade Ideas articles

Yesterday 09:35 AM

Yesterday 12:17 AM

July 25, 2024 10:39 PM

July 25, 2024 05:30 PM